Solar O&M Waste Circularity in India 2026: Inverter, Cable and BOS Recovery
By Sudarshan Karweer · sudarshan@growthifye.com · +91 84510 99371 (Call / WhatsApp) · 2026-09-09
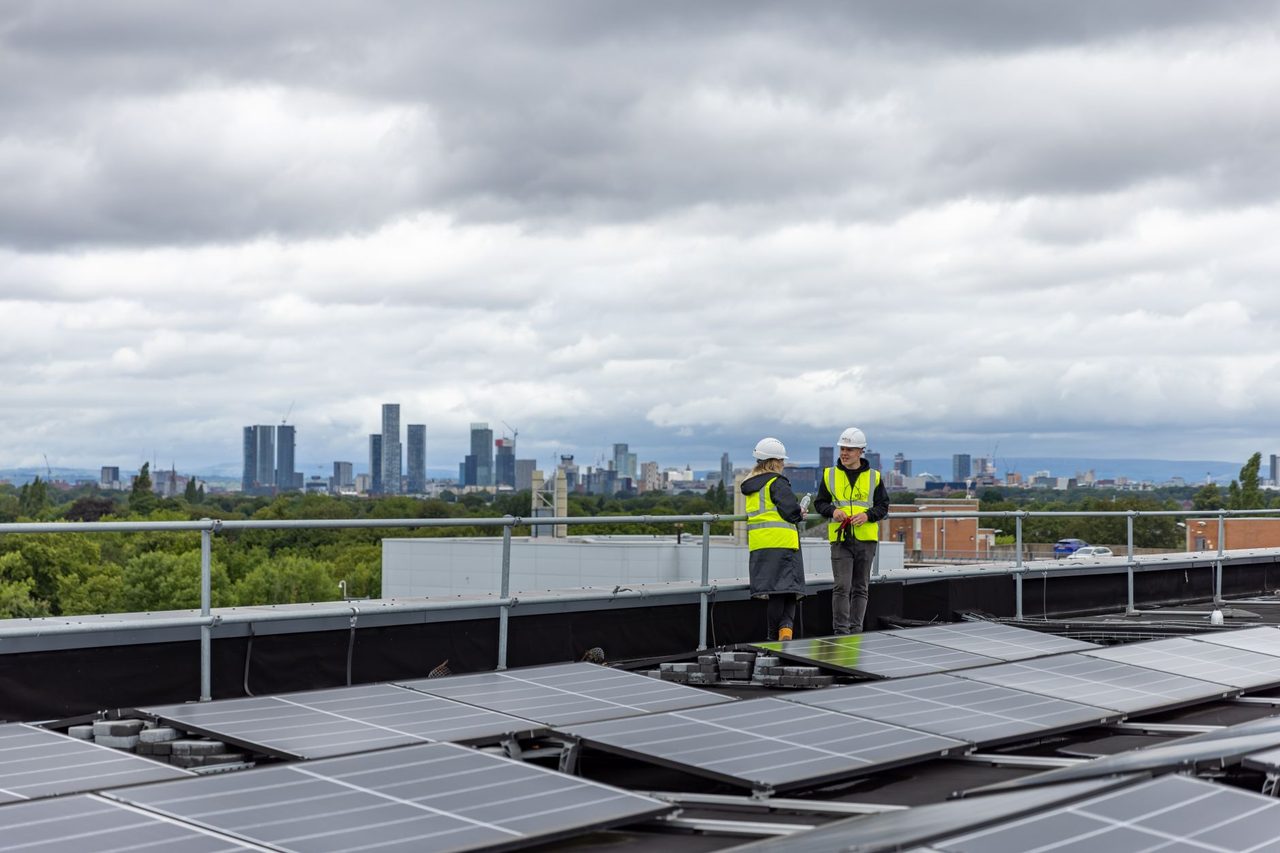
Photo: ThisIsEngineering on Pexels
India’s utility-scale and C&I solar market has spent the last two years talking about end-of-life modules, battery recycling and EPR credits. That was necessary, but it has also created a blind spot. The largest near-term circularity opportunity in many operating portfolios is not 25-year module retirement. It is the steady stream of solar O&M waste already being generated today: failed string inverters, central inverter power stacks, DC cables, AC cables, aluminium and GI structures from repowering, junction boxes, combiner boxes, SCB fuses, connectors, damaged pallets, packaging, transformers and switchgear components.
For Indian asset owners, this is now a 2026 operating-margin, compliance and lender-governance issue. Portfolios built during the 2016-2022 solar boom are entering the phase where inverter replacements, cable theft losses, BOS retrofits and partial repowering are no longer exceptional events. They are recurring line items. If handled poorly, this waste leaks value, raises audit risk and weakens ESG reporting. If handled well, it creates measurable recovery income, better insurance documentation, stronger EPR positioning and cleaner data rooms for refinancing or asset sales.
This article focuses on a topic clearly distinct from module recycling and battery circularity: how to design a circular operating model for solar O&M waste in India in 2026, with concrete economics, policy context and implementation pathways.
Why solar O&M waste is becoming material in 2026
India has crossed a scale where even small failure rates create large annual waste volumes. A 100 MW utility-scale plant may contain:
- 250 to 400 string inverters, depending on architecture
- 1,200 to 1,800 km of DC cable across strings and home runs
- 60 to 120 km of AC and communication cable, depending on layout
- dozens of combiner boxes, LT panels, RMUs and auxiliary systems
- hundreds of tonnes of mounting steel and aluminium over the life of the asset
In the first years of operation, waste generation is low and mostly packaging-related. By years 5 to 10, the waste profile changes materially:
- inverter cards, IGBTs, capacitors and fans fail more frequently
- obsolete inverter models become harder to repair due to spares discontinuation
- cable sections are replaced after theft, rodent damage or hotspot events
- weather exposure degrades connectors, JB components and SCB internals
- repowering and DC oversizing upgrades create BOS scrap before module retirement
For a 500 MW portfolio, annual circularity-relevant O&M waste can easily cross 700 to 1,500 tonnes in 2026 if one includes cable replacements, inverter refurbishment rejects, transformer oil handling, damaged pallets, spare-material obsolescence and structural scrap from retrofits. This is not theoretical. It is already visible in larger IPP and C&I portfolios in Rajasthan, गुजरात, Karnataka, Telangana, Tamil Nadu and Maharashtra.
The issue is that most operators still treat this stream as ad hoc scrap disposal rather than as an engineered recovery program.
What sits inside the value pool
The economics of O&M waste circularity are driven by material mix, contamination and traceability. Unlike full module recycling, where glass dominates weight and depresses per-tonne realisation, O&M waste often contains high-value fractions.
Typical recoverable categories include:
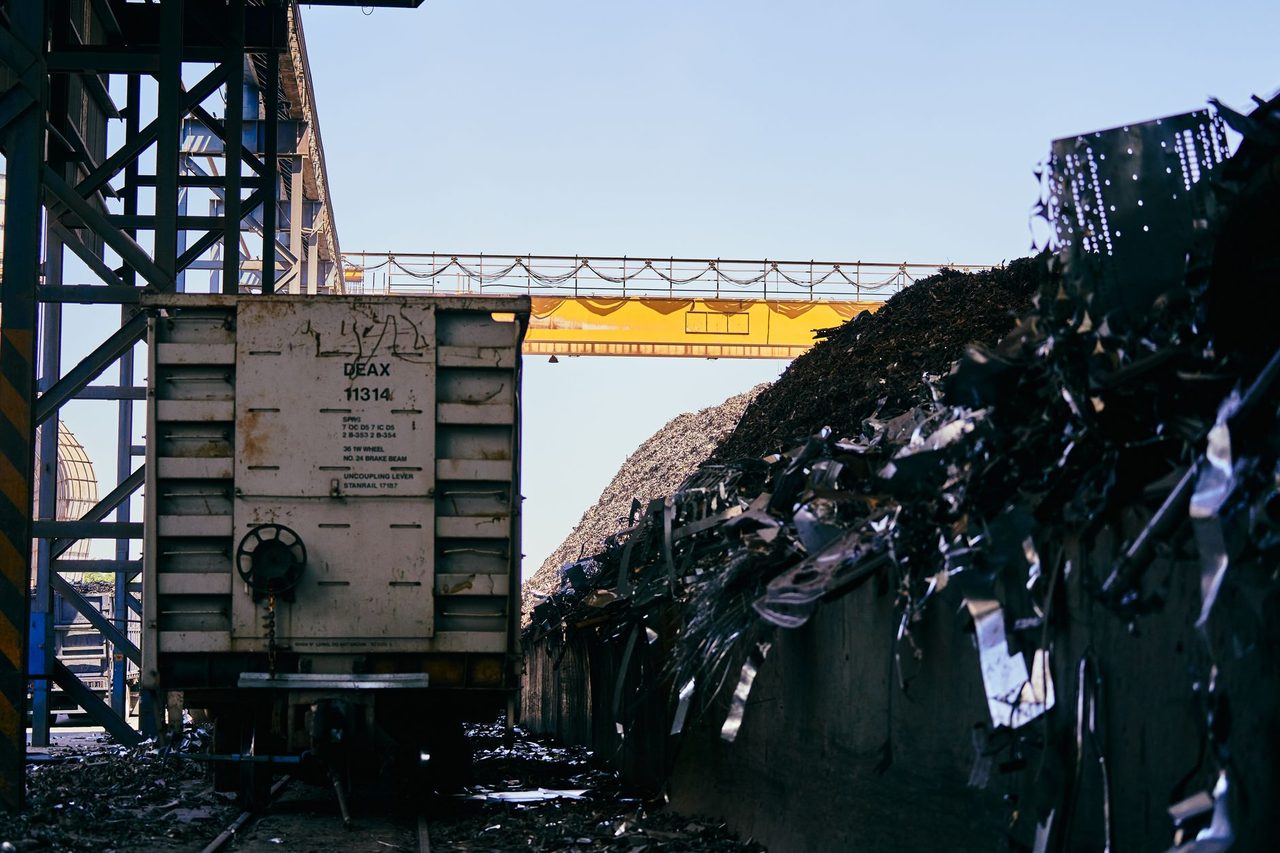
- Copper: DC cable, AC cable, transformer windings, earthing strips, busbars
- Aluminium: inverter housings, cable armour in some cases, trays, frames, terminals
- Ferrous scrap: mounting members from retrofits, kiosks, panels, damaged support steel
- PCB and e-waste fractions: control boards, communication cards, relays, sensors
- Power electronics: IGBTs, capacitors, inductors, rectifier assemblies
- Plastics and rubber: cable insulation, connector housings, gaskets
- Transformer oil and hazardous residues: requiring controlled handling
Indicative 2026 India recovery values vary widely by segregation quality:
- Mixed copper cable scrap: around Rs 280 to Rs 540 per kg depending on insulation, armouring and burn-loss issues
- Clean bright copper after compliant stripping/granulation: often equivalent to 85% to 94% of prevailing copper scrap benchmarks
- Aluminium scrap from housings/trays: roughly Rs 95 to Rs 165 per kg depending on alloy and contamination
- GI/steel scrap: about Rs 24 to Rs 38 per kg in many industrial markets
- PCB-rich e-waste fractions: pricing is contract-specific and can be strongly positive if boards are high-grade, but negative if mixed with low-value contaminated assemblies
- Complete failed string inverters: often sold either on a unit basis for refurbishment harvest or on weight/value basis after testing; spread can exceed 2x depending on whether salvageable boards and power stacks are documented
For developers, the difference between “mixed yard scrap sold locally” and “segregated, documented circular recovery” can be 15% to 40% in net value recovery. In some cases, especially with cable and inverter streams, the gap is higher.
The policy and compliance frame in India
In 2026, the relevant compliance landscape is fragmented across e-waste, hazardous waste, plastic waste, state pollution control procedures, contractual OEM obligations and corporate reporting frameworks. That fragmentation is exactly why many renewable portfolios underperform on circularity.
Key compliance anchors include:
- E-Waste (Management) Rules, 2022 and subsequent implementation practice, especially where inverters, PCBs, control equipment and electrical-electronic assemblies fall within the notified framework
- Hazardous and Other Wastes (Management and Transboundary Movement) Rules, where oils, contaminated residues or specific treatment processes are involved
- Plastic waste and packaging responsibility where imported or domestic equipment packaging streams are significant
- CPCB/SPCB authorisation, manifests and recycler channel checks
- Contractual warranty and take-back clauses with inverter OEMs and electrical package vendors
- Disclosure expectations from lenders, DFIs, infrastructure investors and enterprise offtakers with supply-chain governance requirements
The practical challenge is that solar site teams usually prioritise uptime, not compliance architecture. Scrap may move through local channels without proper category mapping, weighment reconciliation or proof of authorised processing. That creates three risks:
- under-realisation of scrap value
- audit findings on disposal and vendor due diligence
- weak evidence for sustainability reporting and procurement compliance
This is where services such as EPR compliance and Reverse logistics become operationally relevant, not merely advisory labels. The winner in 2026 is the portfolio owner that can connect site-level scrap generation to authorised downstream recovery with transaction-grade documentation.
A workable circular operating model for solar portfolios
A bankable O&M waste circularity program needs more than a scrap buyer. It needs process design across inventory, logistics, vendor qualification and revenue attribution. In practice, the strongest operating model has six layers.
1. Waste mapping by asset class
Start with a site-by-site and portfolio-wide waste register. Map materials by:
- equipment category
- n- expected annual generation
- hazardous/non-hazardous status
- resale, refurbishment or recycling pathway
- ownership and warranty status
- data fields needed for audit and lender reporting
This often uncovers hidden value pools such as obsolete spares inventory, insurance-replaced components, retired SCBs, damaged reels and decommissioned CCTV/electrical ancillaries.
2. Recovery hierarchy
Not every failed inverter should be shredded. The hierarchy should be:
- repair in place
- harvest components for refurbishment
- OEM take-back if commercially sensible
- third-party refurbishment and resale
- compliant material recycling
- disposal only for non-recoverable residues
A 250 kW string inverter carcass sold as mixed e-waste scrap may fetch modest value. The same unit, if triaged and stripped for reusable fans, control boards, display modules and serviceable power sections, can generate materially better economics.
3. Site segregation and packaging SOPs
Most value loss happens at site. Common issues include:
- copper mixed with ferrous scrap
- cable burned informally to remove insulation, destroying compliance and reducing recoverable value
- wet storage of boards and inverter assemblies leading to corrosion
- no tagging of serial numbers or source equipment
- transformer and oil-handling residues mixed with general waste streams
Standard operating procedures should define containerisation, palletisation, tagging, weighment and quarantine rules. Even simple changes can improve net recovery sharply.
4. Qualified recycler and refurbisher network
No single downstream partner is ideal for all fractions. In 2026, the market usually needs a hybrid network:
- authorised e-waste recyclers for PCB/control assemblies
- cable granulators and metal recoverers for copper-heavy streams
- inverter refurbishers for repairable units and parts harvesting
- ferrous and aluminium scrap processors for bulk structural waste
- hazardous waste handlers for oils and contaminated fractions
The commercial model can be structured as fixed pickup plus indexed commodity sharing, or as floor-price plus upside-sharing. The latter is often better where copper and aluminium content is material.
5. Data and documentation layer
Circularity is now a data problem. Lenders and buyers increasingly ask for evidence of material recovery, not just claims. The minimum data stack should capture:
- equipment ID and source site
- gross and net weight by waste category
- dispatch date and transporter details
- recycler authorisation details
- recovery certificate or destruction certificate, as applicable
- realised value and recovery yield estimate
- links to insurance, warranty or replacement capex where relevant
This is where Circularity reporting becomes strategic during refinancing, portfolio sale, ESG assurance and board review.
6. Governance and incentive alignment
If site O&M teams are measured only on uptime and spare turnaround, circularity will remain weak. KPIs should include:
- scrap reconciliation rate
- percentage routed to authorised recovery channels
- net value realisation per category
- turnaround time from equipment failure to final disposition
- variance between booked scrap and actual recovered weight/value
The economics developers and lenders should model
For developers and lenders, the key question is not whether O&M waste has value. It is whether the value is material enough to justify a formal program. In many cases, yes.
Consider a 300 MW mixed utility and C&I solar portfolio in India in 2026. A plausible annual waste and recovery profile could look like this:
- copper-bearing cable scrap: 80 to 140 tonnes
- inverter and power-electronics scrap/refurbishment rejects: 60 to 120 tonnes
- aluminium scrap: 20 to 50 tonnes
- ferrous/BOS scrap from retrofits and damage: 200 to 500 tonnes
- low-value packaging/plastics and mixed residues: 40 to 90 tonnes
Depending on geography, segregation quality and recycler contracts, annual gross recovery could range from roughly Rs 0.6 crore to Rs 2.2 crore. Net value after logistics, dismantling, testing and compliance costs may still land in the Rs 0.35 crore to Rs 1.5 crore range.
That will not transform project IRR on its own. But it is material enough to:
- offset part of annual O&M escalation
- improve economics of inverter replacement programs
- reduce working-capital drag from obsolete spares
- strengthen evidence for responsible asset management
- support cleaner diligence in M&A and refinancing
For repowering-heavy portfolios, the number can be higher. For small rooftop portfolios, the direct value is lower, but governance value is high because distributed sites are more prone to leakages and non-compliant disposal.
Lenders should incorporate three diligence questions:
- Is there a documented scrap and end-of-life governance protocol across the portfolio?
- Are high-value streams such as cables and inverters being monetised through auditable channels?
- Are there contingent liabilities from non-compliant e-waste or hazardous handling?
These questions are increasingly relevant in 2026 as asset operating histories lengthen and technical DD goes deeper.
Where the biggest execution failures happen
In practice, underperformance usually comes from five recurring mistakes.
- Treating all waste as low-value scrap rather than triaging for refurbishment, parts harvesting and category-specific recycling
- Leaving scrap accumulation unmanaged at site for quarters, increasing pilferage, corrosion and bookkeeping mismatch
- Using unauthorised or weakly documented buyers for e-waste streams to maximise short-term recovery at the cost of compliance risk
- Failing to align OEM warranty, insurance salvage and scrap ownership clauses
- Ignoring reverse-logistics design for remote solar parks, where freight can wipe out value if dispatches are too small or poorly consolidated
This is why End-of-life fleet audits are relevant even before true end-of-life. A portfolio audit should not wait until modules retire. It should evaluate what waste is already being generated, where value is leaking and which streams justify central contracting.
What policymakers and DISCOM-linked entities should do next
For policymakers, solar waste circularity should not be framed only as a future module problem. Near-term O&M waste offers a faster testbed for improving compliance and recovery systems.
Priority actions for 2026 include:
- clearer category guidance on renewable-electrical equipment under e-waste implementation practice
- standardised documentation templates for renewable asset scrap movements and recovery proofs
- stronger integration between renewable tenders and disposal/governance obligations for retired equipment
- incentives for formal refurbishment ecosystems, especially for inverters and electrical BOS
- aggregation mechanisms for public-sector and utility-owned distributed solar scrap to improve pricing and compliance
Utilities and public procurers should also pay attention. As feeder solarisation, substation-connected solar and public rooftop programs scale, the waste stream becomes decentralised and harder to monitor. Without a formal aggregation framework, material will continue to leak into opaque channels.
The 2026 takeaway for market participants
India’s circularity discussion is maturing. The easy narrative was to focus on future mountains of retired modules or EV batteries. The more useful 2026 operating reality is that solar O&M waste is already here, already monetisable and already linked to compliance and bankability.
For C&I consumers, developers and IPPs, the right next step is not a generic sustainability statement. It is a portfolio-specific circularity blueprint covering inverters, cables, BOS and repowering scrap. That means material mapping, recovery hierarchy, recycler qualification, contract design, data capture and board-level governance.
For lenders and investors, this should move into routine operating due diligence. Scrap is no longer a side note. It is a marker of operational discipline.
For policymakers, the opportunity is to formalise a practical, high-recovery ecosystem now rather than waiting for the larger end-of-life wave a decade later.
Growthifye supports this transition through advisory-led circular operating models, including Module & battery recycling, Reverse logistics, EPR compliance and End-of-life fleet audits for renewable portfolios.
If your organisation is evaluating solar waste recovery strategy, recycler contracting, portfolio circularity governance or lender-ready reporting, contact Growthifye’s advisory desk.
Explore Growthifye's related capabilities
This analysis connects directly to our advisory practice: End-of-life fleet audits · Second-life battery applications · Module & battery recycling · EPR compliance.
About the author

Chief Executive Officer, Growthifye — With over 23 years in management consulting, Sudarshan has taken businesses from concept to scale — building and scaling new-age digital and energy businesses.
- 23+ years in management consulting
- EY alumnus
- Led large-scale BESS programmes, capital raises and advisory mandates
Want this analysis applied to your project?
Talk to our team