
Energy Management for Commercial & Industrial (C&I)
Cut the power bill of factories, data centres, campuses and industrial clusters — tariff optimisation, rooftop & open-access solar, BESS, PPAs and an India-wide intelligence map of data centres, industrial zones and their associations.
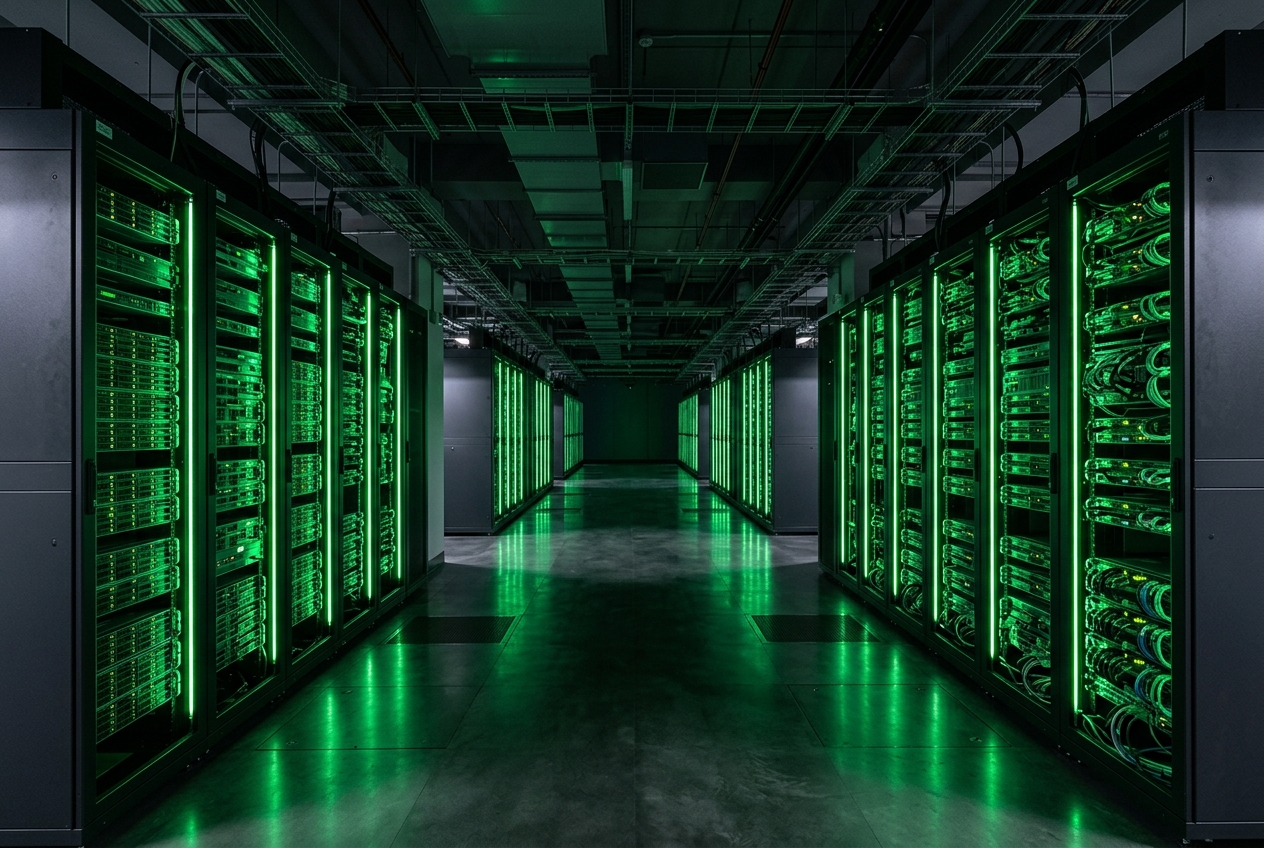
Electricity is the second-largest cost line for most Indian manufacturers and the largest for data centres. We treat it as a managed portfolio: tariff category and ToD optimisation, power-factor and demand management, rooftop and captive solar, group-captive and third-party open access, battery storage for peak shaving and backup, and green PPAs — sequenced by payback.
Our Bill Optimiser parses your monthly bills (MSEDCL, Torrent, TANGEDCO, BESCOM and 40+ DISCOMs), builds the load profile and quantifies every lever — with the regulatory route (net-metering, banking, GEOA rules, cross-subsidy and additional surcharge) for your state.
Underneath sits the C&I Intelligence Map: every operational and planned data centre in India with IT-load capacity, developer and status; key industrial clusters state-wise with products, number of companies, cluster load and average power need per entity; and the industry associations, chambers of commerce and MSME bodies that represent them.
How we deliver
Open any step to see what happens, what we need from you and anonymised sample deliverables with illustrative images.
Everything this practice covers
Get the Energy Management for Commercial & Industrial (C&I) brochure — our step-by-step process, and how we deliver your objectives in time, at optimal cost, with assured quality.
Instant PDF download — we only use your details to follow up.
Energy Management — C&I, in 25 seconds.
Zoom from India → state → cluster → site. Click any marker for details.
Data centres mapped
35
Operational IT load
818 MW
Pipeline IT load
3,021 MW
Industrial clusters
30
Cluster load
10,570 MW
Companies / associations
74,220 / 40
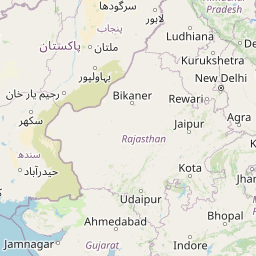
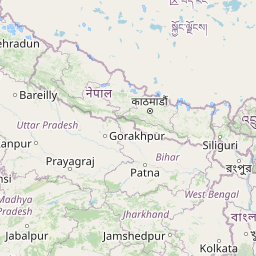
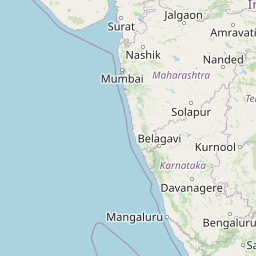
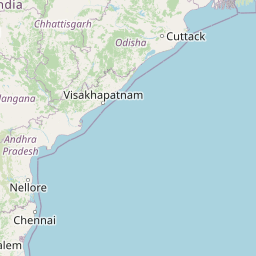
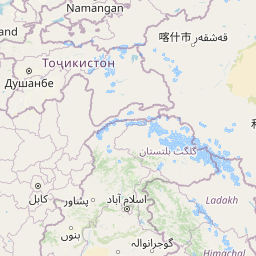
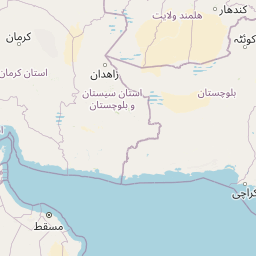


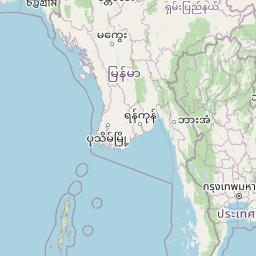
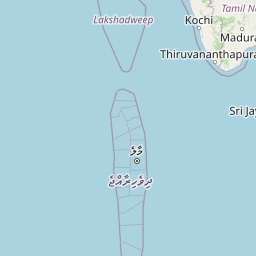

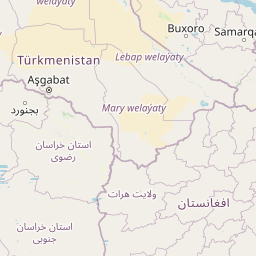
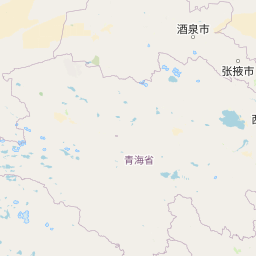

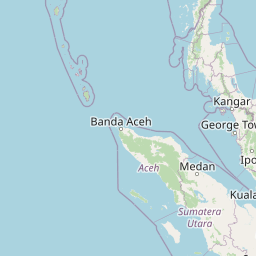
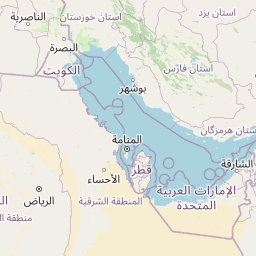
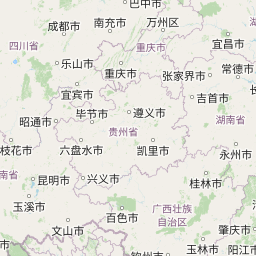
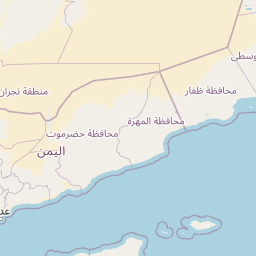

Capacities, loads and company counts are indicative — compiled from public announcements, MIDC/GIDC/SIPCOT data and association websites, refreshed by Vidura. Contact details of associations, office bearers and company owners are visible to the Growthifye BD team only.
Annual bill
₹2,55,00,000
Rooftop / captive solar
₹63,60,000
Open access (50% load)
₹43,50,000
ToD shift
₹8,92,500
PF correction
₹5,10,000
DG replacement (BESS)
₹19,44,000
Peak shaving BESS
₹12,15,000
Total savings / yr
₹1,52,71,500
Indicative, national averages. Upload your bills in the Growthifye Energy Manager for a DISCOM-specific, regulation-checked savings stack — talk to us.
Discuss your energy management — c&i mandate.
Tell us where you are in the journey — we'll respond within one business day with a tailored engagement outline.