AT&C Loss Reduction for Indian DISCOMs 2026: AMI Analytics, DT Metering and ROI
By Sudarshan Karweer · sudarshan@growthifye.com · +91 84510 99371 (Call / WhatsApp) · 2026-09-16
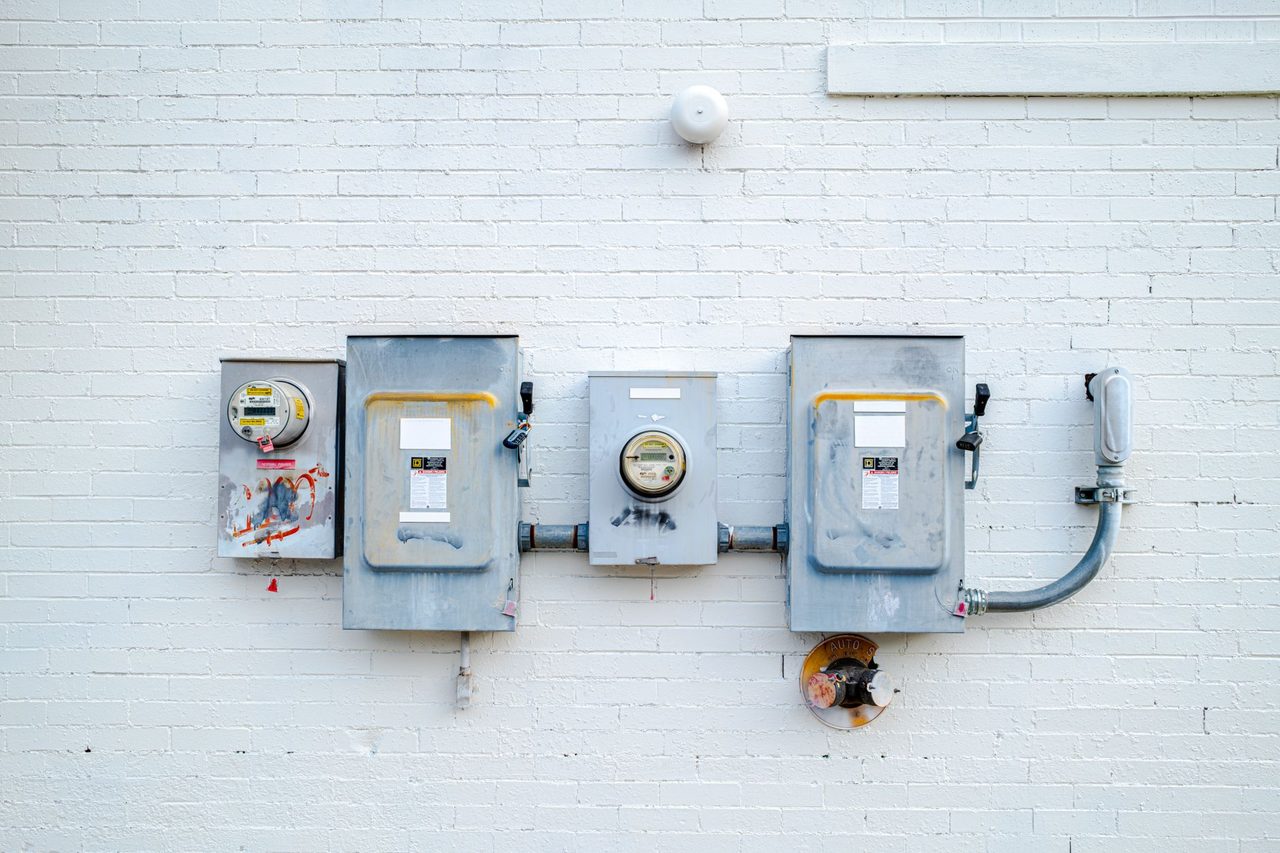
Photo: Anh-Bao Tran-Le on Pexels
Indian DISCOMs entered 2026 with a clear digitalisation mandate: convert capital spend under RDSS into measurable reductions in AT&C losses, better billing efficiency and stronger cash collection. Yet many utilities still treat loss reduction as a meter rollout milestone rather than a system-wide operational programme. That approach under-delivers.
The real opportunity is to connect smart metering, feeder and distribution-transformer energy accounting, theft analytics, outage correlation and field-recovery workflows into one revenue-improvement engine. For C&I consumers, this matters because lower losses and better utility cash flows improve supply quality, reduce the need for ad hoc load-shedding and support more credible network investments. For lenders and developers, it affects the bankability of distribution-linked projects, open-access settlements and payment security.
This article looks at a less-discussed but highly practical angle in utility digitalisation: how Indian DISCOMs can use AMI analytics, DT metering and revenue operations to reduce AT&C losses in 2026, and what level of ROI is realistic under Indian conditions.
Why AT&C loss reduction is still the core DISCOM value pool in 2026
AT&C loss remains the single most important financial metric for most state DISCOMs because it captures both technical and commercial leakage. Even where aggregate technical loss is moderate, poor billing efficiency, low collection efficiency, unmetered pockets, bypass, meter tampering, weak disconnection discipline and delayed recovery can keep total loss levels elevated.
In practical terms:
- A DISCOM at 25% AT&C loss collects revenue on only about 75 units out of every 100 units input into the network.
- If average cost of supply is around Rs 7.0-8.0 per kWh and average realised revenue is below that, every avoidable lost unit compounds the ACS-ARR gap.
- On a 10,000 MU annual input base, a 1 percentage-point reduction in AT&C loss can translate into roughly 100 MU of additional energy billed or collected.
- At an average realisation of Rs 6.0-7.5 per kWh, that implies annual gross value of about Rs 60 crore to Rs 75 crore per percentage-point improvement, before programme cost.
This is why AT&C programmes attract policy focus under the Revamped Distribution Sector Scheme. RDSS has pushed feeder metering, DT metering, consumer indexing, prepaid smart metering and system strengthening. But the hardest part is not capex sanction; it is operational closure after installation.
Utilities that move fastest in 2026 are the ones treating loss reduction as a closed-loop process:
- measure energy accurately at feeder, DT and consumer level
- identify anomalies and probable theft or unbilled consumption
- convert exceptions into field actions within days, not months
- verify results in the next billing cycle
- sustain gains through process discipline and analytics refresh
The 2026 architecture: feeder to DT to consumer energy accounting
The most bankable AT&C reduction model for Indian DISCOMs now starts with granular energy accounting. Without this, AMI data remains interesting but not actionable.
A practical architecture has five layers:
- 11 kV feeder metering with reliable interval data
- distribution-transformer metering across urban and high-loss rural pockets
- consumer smart metering, prioritising C&I, high-value residential and loss-prone clusters
- GIS-linked consumer indexing to map every service connection to the correct DT and feeder
- MDM and analytics workflows that reconcile technical input against billed and collected output
The objective is to create a loss waterfall at each network level:
- feeder input energy
- DT-wise allocated energy
- consumer-wise billed energy
- collection realised against billed amount
- residual gaps indicating technical loss, theft, meter issues or billing failure
This is where many projects stall. Utilities may have feeder meters, AMI endpoints and billing systems, but not a clean network hierarchy. If the utility cannot confidently map which 1,200 consumers sit under a given DT, it cannot localise commercial loss. In that case, management sees aggregate dashboards, but field teams cannot act with precision.
A well-designed programme therefore starts with data hygiene and Vendor-neutral specifications so that meters, HES, MDM, billing and GIS systems exchange data cleanly rather than creating vendor silos.
Where AMI analytics creates measurable loss reduction
Smart metering by itself does not reduce AT&C losses. The value comes from analytics-driven interventions tied to billing and enforcement.
In 2026, the strongest AMI analytics use cases for Indian DISCOMs are the following.
1. Zero-consumption and low-consumption exception detection
A three-phase commercial connection showing prolonged zero or near-zero recorded consumption despite active load indicators is a classic case for site inspection. Similar flags apply where historical monthly consumption suddenly drops 40-60% without a tariff-class explanation.
Typical impact:
- 2% to 5% of smart-metered consumers may enter exception buckets each month
- 15% to 30% of inspected cases may yield billing correction, tamper recovery or load regularisation
- high-value urban C&I pockets often produce the fastest payback
2. Tamper, neutral disturbance and bypass pattern analytics
Modern smart meters can flag events such as terminal cover open, current reversal, magnetic influence and phase anomalies. Event logs are often underused because utilities lack prioritisation logic.
A practical 2026 approach is to score cases by combining:
- tamper event frequency
- night-day load mismatch
- feeder peak coincidence
- payment delinquency
- prior inspection history
This helps enforcement teams target the top 5-10% of high-probability cases instead of chasing raw event volumes.
3. Billing efficiency recovery through remote reads
One of the least glamorous but highest-return use cases is eliminating missed reads and estimated bills. If AMI communication reliability stays above 95-98% for scheduled reads in urban zones, billing efficiency improves materially.
The gain is straightforward:
- fewer provisional bills
- n- less consumer dispute on catch-up billing
- lower meter-reading OPEX
- more predictable monthly cash flow
For DISCOMs with legacy manual reading issues, this alone can support 1-2 percentage-point billing-efficiency improvement in selected circles.
4. Prepaid and disconnection discipline
For government departments, temporary connections, rental clusters and chronic defaulters, prepaid smart metering or controlled remote disconnection can sharply reduce receivables slippage. Not every category is suitable, and regulatory treatment differs by state, but selective use is proving effective.
In circles with weak collection efficiency, the commercial value can exceed pure theft reduction because old receivables often mask the true leakage point.
5. Outage-consumption correlation
A high-loss feeder may partly reflect billing gaps caused by long outages, dead meters or local transformer issues. Linking AMI exceptions with outage records prevents misclassifying every anomaly as theft. This is where broader utility digitalisation, including SCADA / ADMS integration, improves the quality of revenue analytics.
Distribution transformer metering: the missing middle in many RDSS programmes
Consumer smart metering gets most attention, but DT metering often creates the sharpest operational visibility. It is the layer that converts a citywide AMI estate into a localised action map.
Why DT metering matters:
- it identifies the exact pockets where aggregate loss is abnormal
- it separates network issues from consumer-level non-technical loss
- it lets utilities rank transformers by monthly commercial leakage
- it supports transformer overloading analysis alongside revenue protection
Consider a typical urban DT serving 150-300 consumers. If monthly energy input is 45,000 kWh and billed energy is only 30,000 kWh, the apparent gap is 15,000 kWh. Even after allowing, say, 6-8% technical loss depending on topology and loading, the remaining variance can be commercially significant.
At Rs 7 per kWh realisation, a recoverable 5,000 kWh to 8,000 kWh monthly gap on one DT can mean Rs 35,000 to Rs 56,000 per month. Across hundreds of high-loss transformers, that becomes a major revenue pool.
What 2026 leaders are doing differently:
- weekly DT loss ranking rather than monthly passive reporting
- assigning each high-loss DT to a named field officer
- linking analytics cases to inspection closure timelines
- reconciling post-action performance over the next two billing cycles
- escalating repeat-loss pockets into enforcement or network rectification plans
This model works especially well in mixed urban-rural circles where aggregate feeder loss is too blunt an indicator.
Building a credible ROI case for utilities, lenders and policymakers
Loss-reduction business cases in India are often overstated at approval stage and under-evidenced at review stage. A credible ROI model must distinguish between one-time recovery, sustained recurring gain and operational cost.
A practical way to structure ROI in 2026 is to separate benefits into four buckets.
Recurring revenue uplift
This comes from:
- improved billing efficiency
- higher collection efficiency
- reduced theft and bypass
- corrected meter under-recording
- load regularisation and tariff correction
For high-loss urban pockets, recurring revenue improvement of 3% to 8% of billed value in the first 12-18 months is achievable where execution is strong. At utility level, blended outcomes are usually lower because rollout quality varies by circle.
OPEX reduction
Savings arise from:
- lower manual meter-reading costs
- fewer physical disconnection/reconnection visits
- reduced bill delivery and exception handling
- lower complaint handling on estimated bills
These are real but should not be the primary justification. In most Indian cases, the revenue gain dominates the economics.
Working-capital improvement
Faster billing cycles and better collection reduce receivables days. This matters materially for stressed DISCOMs facing high short-term borrowing costs and delayed subsidy receipts.
Loss localisation for capex prioritisation
Energy accounting also improves network capex efficiency. Instead of broad-brush conductor augmentation, utilities can direct funds toward feeders and DTs where technical strengthening and commercial enforcement together produce the best outcome.
For lenders evaluating digitisation programmes, key diligence questions include:
- Is consumer indexing above 95% in target areas?
- Are feeder and DT meters time-synchronised and producing usable data?
- Is the billing system integrated with HES and MDM without manual workarounds?
- Does the utility have circle-level enforcement capacity to act on analytics?
- Are baseline losses measured cleanly before intervention?
- Is there a governance mechanism from FAT to SAT through operational acceptance?
Without these elements, projected AT&C gains are far less dependable than vendor proposals suggest.
Common implementation failures Indian DISCOMs should avoid
The sector now has enough project history to identify repeat mistakes.
Treating installation as completion
A smart meter fixed on a wall but not reliably communicating, mapped, billed and acted upon has little commercial value. Utilities should track business-active meters, not just installed meters.
Weak master data and asset hierarchy
If consumer number, feeder code, DT ID, GIS record and billing database do not match, analytics quality collapses. Data cleansing is not optional.
No revenue-operations ownership
IT teams can deploy platforms, but circle revenue teams must own exception closure. Loss reduction fails when insights never convert to field action.
Ignoring HT and high-value LT segmentation
A small number of high-value consumers can contribute a disproportionate share of revenue leakage. These should receive separate analytics and compliance workflows.
Overlooking change management
Meter readers, billing staff, linemen, enforcement teams and call centres all need revised SOPs. Technology alone does not change utility behaviour.
No measurement-and-verification discipline
Every target circle should have a pre-intervention baseline and monthly post-intervention review. Otherwise, seasonal demand changes can be mistaken for programme success.
What C&I consumers and developers should watch in 2026
This topic is not only for utilities. C&I consumers, captive and open-access users, and renewable developers should track distribution digitalisation because it affects settlement quality, outage visibility and payment culture.
For C&I consumers:
- improved utility metering and billing systems reduce disputes on demand, TOD and consumption records
- better collection health at the DISCOM supports network maintenance and service continuity
- more precise outage data can strengthen compensation and service-level discussions where regulations provide for it
For renewable developers and storage players:
- healthier DISCOM cash flows improve counterparty confidence
- cleaner meter data helps with scheduling, settlement and behind-the-meter integration
- lower local losses can reduce resistance to additional load electrification and distributed resources
For policymakers:
- the next phase of RDSS success should be assessed on realised AT&C reduction and billing efficiency, not just meter deployment counts
- circle-level benchmarking is more useful than statewide average claims
- interoperability and operational governance deserve equal weight alongside procurement speed
This is also where specialist support matters. Utilities increasingly need advisory partners that understand not just AMI procurement, but the full operating model spanning data architecture, analytics use cases, field workflows and acceptance governance. In selected programmes, related capabilities such as FLISR & self-healing networks can complement revenue initiatives by improving outage data integrity and supply restoration performance in the same geography.
The practical 2026 playbook
For Indian DISCOMs looking to deliver visible results within 12 months, the most pragmatic sequence is:
- complete consumer indexing and clean feeder-DT-consumer hierarchy in target circles
- ensure feeder and DT metering quality before scaling consumer analytics
- prioritise high-value urban and high-loss mixed-load pockets first
- configure 8-12 actionable AMI exception use cases rather than 100 passive dashboards
- assign field accountability and closure SLAs for each case category
- review revenue uplift and loss movement monthly at circle and utility level
- expand only after proving repeatable gains
This is less glamorous than broad digital transformation language, but it is how bankable AT&C reduction is actually achieved.
In 2026, the winning DISCOMs will not be those with the largest meter installation numbers alone. They will be the ones that turn interval data into billed revenue, billed revenue into collected cash and collected cash into sustained network improvement.
If your utility, lending team or project platform is evaluating an AT&C loss reduction roadmap under RDSS or beyond, contact Growthifye’s advisory desk for a practical assessment of data architecture, execution risks and revenue-linked ROI.
Explore Growthifye's related capabilities
This analysis connects directly to our advisory practice: IEC 61850 substation automation · FLISR & self-healing networks · DER management systems · SCADA / ADMS integration.
About the author

Chief Executive Officer, Growthifye — With over 23 years in management consulting, Sudarshan has taken businesses from concept to scale — building and scaling new-age digital and energy businesses.
- 23+ years in management consulting
- EY alumnus
- Led large-scale BESS programmes, capital raises and advisory mandates
Want this analysis applied to your project?
Talk to our team