OMS for Indian DISCOMs 2026: Outage Management, CAIDI Reduction and RDSS ROI
By Sudarshan Karweer · sudarshan@growthifye.com · +91 84510 99371 (Call / WhatsApp) · 2026-09-19

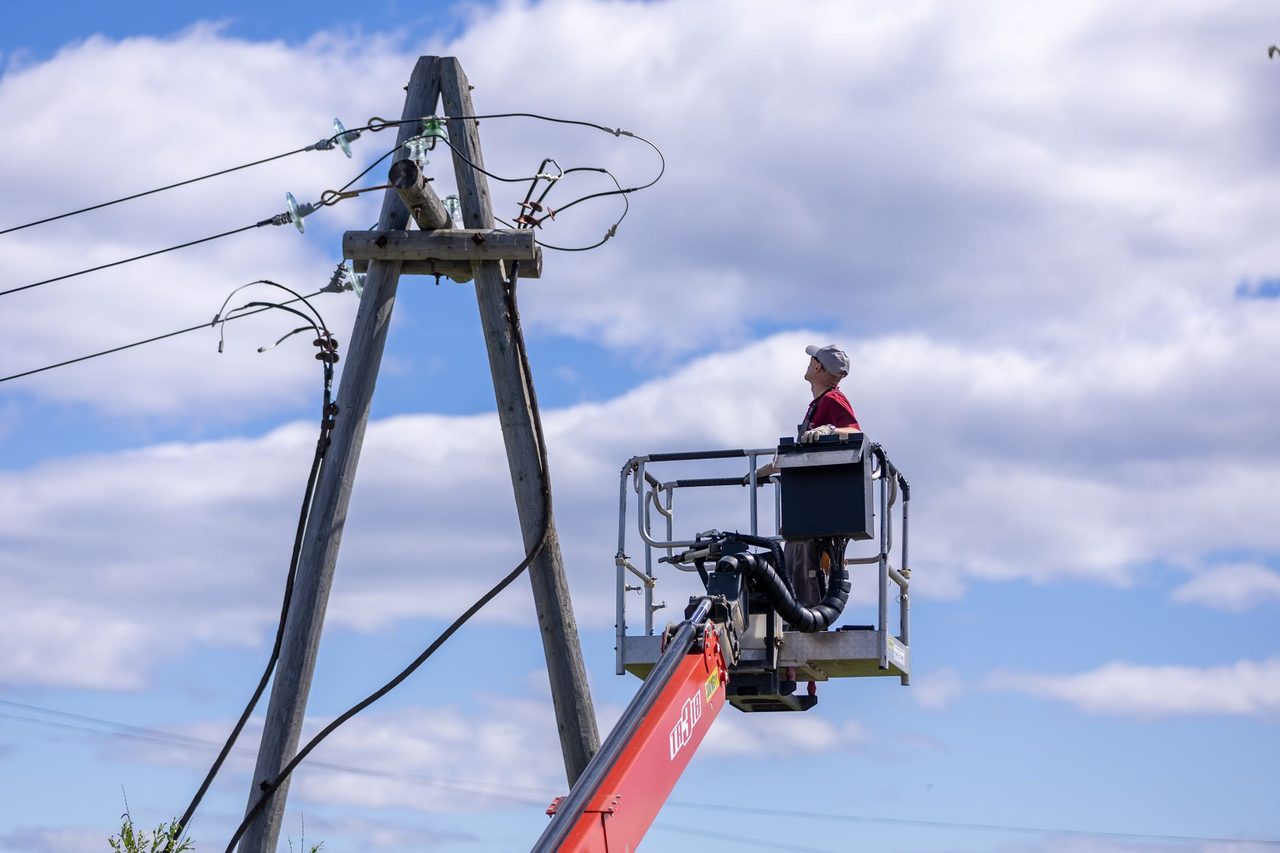
Photo: Du Tử Mộng on Pexels
India’s utility digitalisation conversation has moved beyond basic smart metering and substation visibility. In 2026, the real operational question for many DISCOMs is simpler: when faults occur, can the utility detect them fast, localise them accurately, dispatch the right crew, restore supply in the shortest possible time, and document the event for regulators, consumers and internal performance review?
That is the operating space of an outage management system, or OMS.
For Indian DISCOMs, OMS is now emerging as a distinct priority alongside AMI, SCADA, GIS, call-centre modernisation and field-force digitisation. Unlike topics such as meter data management, ADMS convergence or FLISR, the OMS discussion is about the full outage lifecycle: event ingestion, outage prediction, customer correlation, switching coordination, crew dispatch, restoration tracking, reliability reporting and post-event analytics.
For C&I consumers, this matters because outage duration now directly affects production losses, diesel backup costs, process uptime and power-quality risk. For lenders and project developers, feeder-level and town-level reliability increasingly influence demand growth, open-access migration risk and collection quality. For utilities and policymakers, OMS is becoming a practical tool to improve supply reliability without waiting for every feeder and substation to reach full automation maturity.
Why OMS matters for Indian DISCOMs in 2026
Indian distribution utilities are under pressure from multiple directions at once:
- RDSS-linked expectations on loss reduction, service improvement and digitalisation
- Rising consumer intolerance for long restoration times, especially in urban and industrial pockets
- Higher rooftop solar, EV charging and distributed energy complexity at the edge of the network
- Growing scrutiny of reliability KPIs by state regulators and public grievance platforms
- Pressure to reduce O&M leakage caused by manual complaint logging and inefficient field response
Historically, many DISCOMs have managed outages through fragmented workflows. A fuse-off call may be received at the subdivision office, while a feeder trip appears separately in SCADA, and a transformer failure is reported later through field staff or WhatsApp groups. In such a model, the utility often lacks one common operational picture.
OMS solves that fragmentation. It creates a single operational layer that correlates outage signals from:
- Consumer calls and IVR logs
- Mobile app complaints
- AMI last-gasp and power restoration messages
- SCADA alarms from substations and feeders
- GIS network topology
- DT meter or feeder meter events
- Field crew updates from handheld devices
The result is not just better visibility. It is a measurable reduction in time spent on three costly steps:
- Time to detect the outage
- Time to locate the probable fault zone
- Time to restore and close the incident properly
For many urban and semi-urban utilities, shaving even 20 to 40 minutes from average restoration time can create visible consumer impact. For industrial zones where outage costs may run from Rs 50,000 to several lakh per event depending on process sensitivity, that improvement has direct economic value.
OMS is different from SCADA, AMI and call-centre software
A common procurement mistake in India is assuming that outage management is automatically covered if the utility already has SCADA, AMI or a CRM platform. In reality, these systems address only parts of the problem.
- SCADA sees instrumented assets, mainly substations and some feeders, but usually not every low-voltage consumer or localised fuse failure
- AMI sees meter-level events, but by itself does not always infer upstream network outages reliably without topology and correlation logic
- CRM records complaints, but does not automatically predict outage extent or support switching and restoration workflows
- GIS stores network maps, but unless maintained with electrical connectivity and switching status, it cannot support operational outage analysis
OMS sits between these systems and combines them into an outage-centric operational workflow.
A mature OMS in an Indian DISCOM context should typically support:
- Event acquisition from SCADA, AMI, IVR, CRM and mobile channels
- Topology-based outage prediction using GIS and connectivity models
- Affected consumer estimation by feeder, DT, section and service area
- Crew assignment based on geography, skill and workload
- Switching plan coordination for isolation and restoration
- Estimated restoration time communication to consumers
- Major event mode during storms, flooding or cyclone conditions
- Reliability analytics for SAIDI, SAIFI, CAIDI and repeat outage patterns
Where utilities are also planning SCADA / ADMS integration, the OMS architecture should be designed so it does not become a silo or duplicate switching authority.
Practical architecture for Indian utility conditions
The right OMS design in India depends less on software branding and more on data maturity. A utility with 90 percent-plus feeder SCADA and a clean GIS can aim for advanced outage prediction early. A utility with patchy GIS and mixed AMI coverage may need a phased approach.
A practical 2026 architecture usually includes the following layers:
1. Source systems
- SCADA for breaker, feeder and substation alarms
- AMI/HES for last-gasp and restoration pings from smart meters
- GIS with electrically connected network model
- CRM/CC&B/call-centre platform for consumer complaints
- Workforce management or mobile field-service tools
- DT and feeder metering systems where available
2. Integration layer
Utilities should avoid one-off point integrations wherever possible. API-led or message-bus architecture is more sustainable, especially where multiple OEMs are involved under RDSS packages. This is where Vendor-neutral specifications become important in tenders.
3. Core OMS engine
This includes:
- Event filtering and de-duplication
- Outage prediction logic
- Connectivity tracing
- Incident prioritisation
- Switching and restoration workflow
- Crew dispatch logic
- Consumer communication interfaces
4. User interfaces
- Control-room consoles
- Division and circle dashboards
- Mobile apps for line staff and contractors
- Management KPI dashboards
- Consumer outage notification interfaces
5. Reporting and analytics
- Reliability indices by feeder, town, subdivision and consumer category
- Restoration performance by crew and contractor
- Repeat failure heatmaps
- DT and feeder sections with chronic outage patterns
- Event audit trail for regulatory submissions
The biggest technical dependency is GIS quality. If the utility does not know with confidence which consumers are mapped to which DT, feeder and switching section, OMS accuracy will suffer. In several Indian projects, the first six to nine months should be treated as a data-hardening period rather than a pure software deployment exercise.
Business case: where the ROI actually comes from
OMS business cases are often oversold using broad reliability claims. A better approach is to quantify specific value streams.
1. Lower restoration duration
If a DISCOM currently averages a CAIDI of 140 to 220 minutes on urban feeder-linked outages, OMS-led correlation and dispatch can often reduce this by 15 to 30 percent in the first operating cycle, depending on existing digital maturity.
For example:
- Current average restoration duration: 160 minutes
- Post-OMS average on eligible outage classes: 120 to 135 minutes
- Improvement: 25 to 40 minutes per event
This translates into fewer complaint escalations, lower overtime inefficiency and better consumer service outcomes.
2. Reduced complaint-handling cost
A utility that receives 20,000 to 100,000 outage-related calls per month can reduce duplicate complaint handling if outages are identified and broadcast proactively. Even a saving of Rs 8 to Rs 20 per avoided repeat interaction can become material at scale.
3. Better field productivity
Crew time is lost when fault location is uncertain or multiple teams are sent to the wrong area. OMS with GIS correlation and mobile dispatch can reduce truck rolls, repeat visits and non-productive search time.
A 10 to 15 percent productivity gain in outage-response teams is realistic in many circles where current processes are still phone-based.
4. Reliability-linked commercial benefit
Improved reliability lowers diesel backup dependence for paying C&I consumers and can moderate migration pressure toward partial self-supply or open-access alternatives. While not easy to book directly in utility accounts, this is strategically important in high-value industrial and commercial zones.
5. Better capex prioritisation
Outage analytics reveal chronic sections, weak DT clusters, recurring cable-fault zones and vegetation-linked pockets. That enables better annual works planning under state capex, RDSS-linked system strengthening or utility-funded reliability investments.
For medium to large DISCOMs, OMS programme costs vary widely by scale and integration complexity. A utility-wide deployment may range from around Rs 15 crore to Rs 60 crore or more when software, integration, GIS improvement, mobility, training and command-centre modernisation are included. The payback logic is strongest where the utility already has significant AMI and feeder automation footprints and can therefore use existing data streams.
RDSS fitment and procurement priorities
In 2026, OMS should not be positioned as a standalone IT purchase. It should be framed as an operational layer that improves value capture from already-funded digital assets.
That means the strongest RDSS-aligned case is usually:
- Smart metering already underway or substantially deployed in target areas
- Feeder and DT metering data available or improving
- GIS available and being corrected
- Call-centre or consumer service channels digitised
- Basic control-centre and field mobility infrastructure in place
Key procurement priorities for Indian DISCOMs include:
- Topology model ownership by the utility, not only the vendor
- Open integration standards and documented APIs
- Event volumes and latency performance guarantees
- Clear role separation between OMS, SCADA and billing/CRM systems
- Cybersecurity controls for field and control-centre access
- Hindi and regional language support where field operations need it
- Measurable acceptance tests during FAT to SAT
Too many tenders focus on feature checklists rather than operational use cases. A better RFP structure would evaluate vendors on specific workflows such as:
- 11 kV feeder trip with partial restoration and downstream fuse-off complaints
- Underground cable fault in dense urban area with multiple consumer calls
- DT failure with AMI last-gasp events and transformer replacement workflow
- Weather-triggered major outage event with contractor crew mobilisation
The utility should require demonstration of these workflows using realistic Indian network data.
KPIs that matter after go-live
OMS success should not be judged by software commissioning alone. The first 12 months should track hard operational KPIs.
Recommended KPIs include:
- Outage detection time from event start
- Percentage of outages auto-identified before mass consumer complaints
- Mean time to assign crew
- Mean travel plus fault-location time
- CAIDI reduction by feeder class and service area
- SAIFI and SAIDI trend in OMS-covered zones
- Repeat outages within 7, 30 and 90 days
- Percentage of incidents with complete cause coding
- Consumer notification success rate
- Share of outage incidents closed with full digital audit trail
Utilities should also segment performance by urban, semi-urban and rural categories. A single statewide average can hide weak execution pockets.
For regulators and policymakers, OMS can support more credible reliability reporting if outage taxonomy is standardised. Distinguishing planned outages, transient interruptions, upstream transmission-linked events, local equipment failure and weather impacts is critical. Without this, reliability dashboards often mix non-comparable events.
What C&I consumers, developers and lenders should watch
OMS may sound like a utility-internal platform, but external stakeholders should pay close attention.
For C&I power users:
- Feeder and area-level outage performance can influence backup sizing, diesel use and process planning
- Better outage communications improve production scheduling and maintenance planning
- Industrial parks with improved restoration performance become more bankable for expansion
For renewable developers and storage players:
- Better outage data helps identify weak substations, feeders and host networks for interconnection planning
- Distribution reliability affects the operating context for rooftop solar, BESS and EV charging portfolios
- As DER management systems scale, OMS-grade outage visibility becomes even more important for coordinated field operations
For lenders and investors:
- OMS maturity is a proxy for operational discipline in utilities with expanding digital infrastructure
- Better restoration and complaint handling can support collection resilience and service-quality perception
- Data-backed reliability reporting improves diligence on distribution franchise, utility reform and industrial load growth assumptions
For policymakers:
- OMS can deliver visible service improvement faster than some long-gestation hardware upgrades
- It helps monetise existing RDSS digital investment rather than adding another isolated application
- It can form the operational bridge toward more advanced automation such as FLISR & self-healing networks in high-value urban zones
Implementation roadmap: start with service territories, not whole-state ambition
The safest rollout approach is phased.
Phase 1 should usually target:
- One major city circle or industrial belt
- Feeder zones with good AMI density
- GIS areas with relatively higher asset mapping quality
- Control rooms with stable staffing and escalation discipline
Phase 2 can expand to:
- Additional urban and semi-urban circles
- DT-linked outage analytics
- Broader field mobility and contractor workflows
- Integration with switching approval processes
Phase 3 can add:
- Storm mode and disaster response workflows
- Reliability-driven capex planning analytics
- Tighter integration with advanced control applications
- Selective automation with switching and self-healing use cases
The key lesson is that OMS is not just software installation. It is utility process reform anchored in digital evidence.
In 2026, Indian DISCOMs that have already invested in smart metering, feeder visibility and GIS now need to extract service-value from those assets. OMS is one of the clearest ways to do that. It turns scattered alarms, calls and meter events into action: who is out, where the fault likely sits, which crew should move, what consumers should be told, and how the utility proves improvement.
For a sector under constant pressure to improve reliability while protecting finances, that is not a cosmetic digital layer. It is operational infrastructure.
If your utility, investment team or industrial power portfolio is evaluating outage-management strategy, contact Growthifye’s advisory desk for practical support on architecture, specifications, integration planning and implementation oversight.
Explore Growthifye's related capabilities
This analysis connects directly to our advisory practice: IEC 61850 substation automation · FLISR & self-healing networks · DER management systems · SCADA / ADMS integration.
About the author

Chief Executive Officer, Growthifye — With over 23 years in management consulting, Sudarshan has taken businesses from concept to scale — building and scaling new-age digital and energy businesses.
- 23+ years in management consulting
- EY alumnus
- Led large-scale BESS programmes, capital raises and advisory mandates
Want this analysis applied to your project?
Talk to our team