Concept, sizing & RTC/FDRE modelling
Concept, Sizing & RTC/FDRE Modelling for Bankable Hybrid & Storage Portfolios
We translate resource and load data into an optimised technical configuration — BESS power/duration, hybrid solar-wind-storage mix, and RTC/FDRE dispatch profiles — stress-tested against degradation, round-trip efficiency loss and tariff risk, so the design that goes to detailed engineering is the one that actually clears financial close.
Typical duration · 6-10 weeks, depending on portfolio complexity and number of scenarios modelled
Samples generated 05 Sept 2026, 11:26 pm ISTWhat happens in this step
- 01Translate Step 01 resource/load outputs into candidate technical configurations (solar:wind:BESS ratios, power-to-energy ratios)
- 02Run BESS power/duration optimisation across tariff, ancillary and contract structures to find the least-cost MW/MWh combination
- 03Build 8760-hour hybrid RTC/FDRE dispatch model incorporating curtailment, forecasting error and peak-shortfall penalties
- 04Layer in degradation curves (solar, wind, cell) and RTE fade over project life to test 25-year energy delivery
- 05Stress-test the configuration against low-RTE, high-degradation, and adverse-weather-year scenarios
- 06Benchmark augmentation strategies (capacity top-up years, replacement cost timing) against contract penalty exposure
- 07Issue sizing recommendation with sensitivity grid, LCOE/LCOS and compliance-probability outputs for investment decision
What we need from you
- Resource & load analytics outputs from Step 01 (irradiance/wind time-series, load/demand curves)
- Draft or executed PPA/tender terms — RTC/FDRE obligation windows, penalty structure, availability requirements
- Site constraints (land parcel, grid connectivity voltage/capacity, evacuation study if available)
- Indicative equipment shortlist or vendor datasheets (cell chemistry, PCS, module/turbine specs)
- Financing assumptions (target IRR, debt tenor, DSCR floor) for LCOE/LCOS benchmarking
- Any existing feasibility or DPR documents for brownfield/expansion cases

Worked example (anonymised, illustrative)
Hybrid RTC Supply Portfolio · 300 MW solar + 150 MW wind + 300 MW/1,200 MWh BESS · Western India
Illustrative round-the-clock supply portfolio modelled for a state DISCOM tender requiring 85% annual availability against a flat RTC schedule.
Sample deliverables from this step
Every sample below is analyst-written and anonymised for illustration — structure and depth mirror our real deliverables; figures and names are not from any client engagement.
 Illustrative · Growthifye-prepared
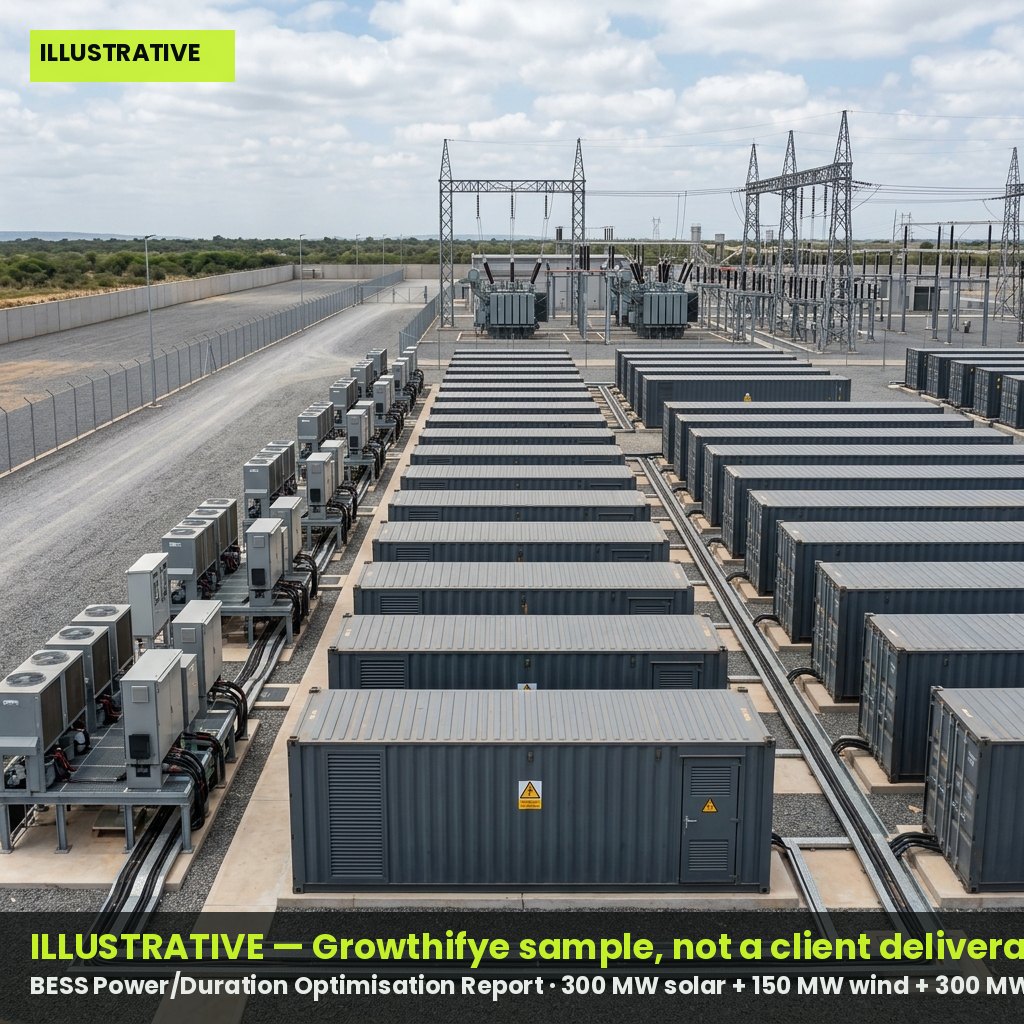
BESS Power/Duration Optimisation Report
Comparative sizing analysis identifying the least-cost MW/MWh combination across contract, tariff and augmentation scenarios.
Sample excerpt · Sizing Scenario Summary (illustrative) — illustrative figures
| Scenario | Power (MW) | Duration (h) | Energy (MWh) | RTE (%) | LCOS (₹/kWh) | 1st Augmentation (yr) |
| S1 - Base | 300 | 4.0 | 1,200 | 86 | 5.9 | 9 |
| S2 - Long duration | 250 | 5.0 | 1,250 | 85 | 6.4 | 11 |
| S3 - High power | 350 | 3.4 | 1,190 | 87 | 6.1 | 8 |
| S4 - Recommended | 300 | 4.0 | 1,200 | 86 | 5.7 | 10 |
| S5 - Low capex | 280 | 3.8 | 1,064 | 85 | 6.8 | 7 |
- LCOS figures are illustrative and exclude land, financing and evacuation costs
- Augmentation year assumes 2.5% p.a. capacity fade with 70% end-of-life retention floor
 Illustrative · Growthifye-prepared
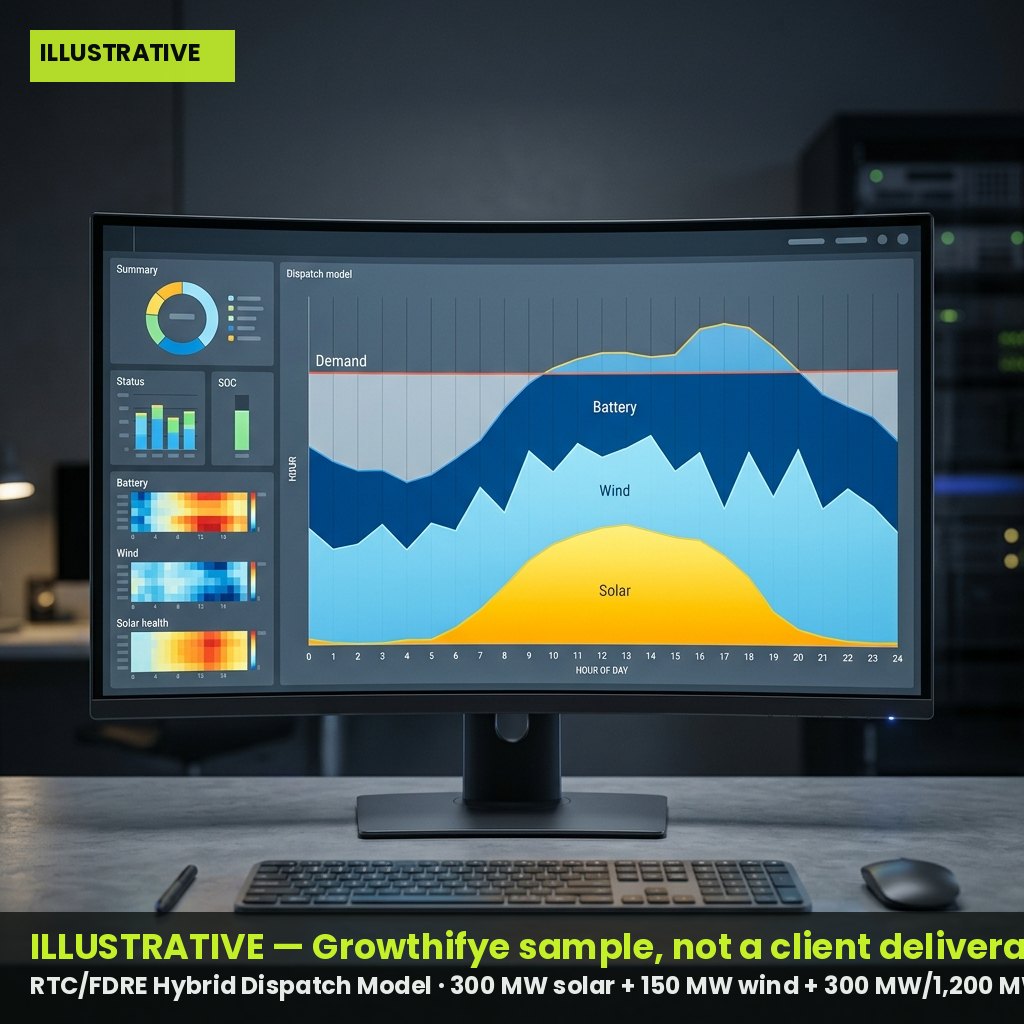
RTC/FDRE Hybrid Dispatch Model
8760-hour simulation of solar-wind-storage dispatch against RTC obligation, with sensitivity grid on capacity mix and compliance probability.
Sample excerpt · Portfolio Mix Sensitivity Grid (illustrative) — illustrative figures
| Solar (MW) | Wind (MW) | BESS (MW/MWh) | Annual CUF (%) | RTC Compliance (%) | Peak Shortfall (hrs/yr) |
| 300 | 150 | 300/1,200 | 44 | 92 | 38 |
| 320 | 130 | 300/1,200 | 43 | 89 | 52 |
| 280 | 170 | 300/1,200 | 45 | 94 | 29 |
| 300 | 150 | 250/1,000 | 44 | 86 | 71 |
| 300 | 150 | 350/1,400 | 44 | 96 | 18 |
- Compliance % measured against a flat RTC schedule net of forecast curtailment
- Model is delivered in editable form for the client's internal use post-engagement
Degradation & RTE Stress-Test Memo
25-year energy-delivery stress test under low-RTE and accelerated-degradation cases, with augmentation trigger points flagged.
Sample excerpt · Degradation & RTE Stress-Test (illustrative, Year 1-25 excerpt) — illustrative figures
| Year | Capacity Retention (%) | RTE (%) | Augmentation Trigger | Residual Energy (MWh) |
| 1 | 100 | 88 | No | 1,200 |
| 5 | 94 | 87 | No | 1,128 |
| 10 | 86 | 85 | Yes - Tranche 1 | 1,032 |
| 15 | 79 | 83 | No | 948 |
| 20 | 72 | 81 | Yes - Tranche 2 | 864 |
| 25 | 68 | 79 | Monitor | 816 |
- Stress case assumes 1.5x manufacturer-warranted degradation rate
- Augmentation tranches sized to hold contracted energy floor above penalty threshold
Yield Study & Bankability Dashboard
P50/P90 annual generation estimates with degradation and availability assumptions, formatted for lender and IC review.
Sample excerpt · P50/P90 Annual Yield Summary (illustrative) — illustrative figures
| Year | P50 (MU) | P90 (MU) | Degradation (%) | Availability (%) |
| 1 | 912 | 861 | 0.0 | 98.5 |
| 5 | 886 | 832 | 0.7 | 98.0 |
| 10 | 852 | 796 | 1.4 | 97.5 |
| 15 | 819 | 761 | 2.1 | 97.0 |
| 20 | 788 | 728 | 2.8 | 96.5 |
- P90 derived from resource dataset uncertainty combined with plant-level performance risk
- Dashboard is delivered as a live workbook alongside the static PDF summary
Outcomes
- A financially optimised BESS power/duration and hybrid capacity mix, backed by scenario and sensitivity analysis
- Quantified RTC/FDRE compliance probability and penalty-risk exposure ahead of PPA signing or financial close
- A degradation- and RTE-tested 25-year energy delivery profile accepted by lenders and internal investment committees
- A clear, costed augmentation roadmap that protects contracted output without over-sizing capex upfront
Questions clients ask
Can this step be run before a PPA/tender is finalised, using indicative terms?
Yes — we frequently model against draft or indicative RTC/FDRE terms during bid preparation, then refresh the model once terms are executed to confirm the final sizing before detailed engineering begins.
Do you model third-party or vendor-specific BESS chemistries, or only generic assumptions?
Both. Where a vendor shortlist exists we use their datasheet-specific degradation, RTE and augmentation parameters; otherwise we apply conservative generic LFP/NMC assumptions clearly flagged as such in the report.
How does this differ from the resource and load analytics step?
Step 01 characterises the resource and demand; this step uses those outputs to actually size and configure the plant — the BESS duration, hybrid mix and dispatch strategy — and pressure-tests that configuration against real-world degradation and efficiency loss.