Resource & load analytics
Resource & Load Analytics: Data-Driven Foundations for RE & Storage Decisions
Before any sizing or investment decision, we quantify the real opportunity using granular data. This step combines 15-minute interval load studies, satellite and ground-validated solar/wind/small-hydro resource assessment, and ToD tariff mapping to reveal where energy arbitrage, peak shaving, and renewable integration genuinely create value — replacing assumptions with evidence.
Typical duration · 3-5 weeks depending on data availability and site count
Samples generated 05 Sept 2026, 11:26 pm ISTWhat happens in this step
- 01Collect 12-24 months of 15-minute interval load/generation data from SCADA, smart meters or DISCOM records
- 02Clean, validate and profile load data to identify peak/off-peak patterns, seasonality and load factor trends
- 03Overlay ToD/ToU tariff structures and demand charges to map real cost-of-energy by time block
- 04Assess solar irradiance (satellite + ground pyranometer where available), wind resource (mast data/reanalysis) or small-hydro flow duration as applicable
- 05Model P50/P90 generation yield estimates and correlate with load profile for self-consumption/export potential
- 06Quantify the addressable opportunity: arbitrage spread, peak-shaving MW, curtailment risk, and contract-structure fit (RTC/FDRE/merchant)
- 07Present findings in a data pack with clear go/no-go indicators for the next design stage
What we need from you
- Historical load/generation interval data (15-min, min. 12 months preferred)
- Site GPS coordinates and available land/rooftop/substation layout
- Applicable DISCOM tariff orders, ToD slabs and demand charge structure
- Any existing metering, SCADA or energy audit reports
- Grid connectivity details (voltage level, available headroom, nearest substation)
- Site-specific wind mast or hydrology data, if previously collected
- Business objectives (cost saving, RE24 compliance, green PPA, merchant exposure)

Worked example (anonymised, illustrative)
Illustrative Study: Industrial Load + Hybrid RE Feasibility · 18 MW average industrial load; solar-wind-storage hybrid under evaluation · Western India
A process manufacturing facility sought to understand whether a hybrid solar-wind-BESS system could offset ToD peak charges and reduce grid dependency, before committing to detailed design.
Sample deliverables from this step
Every sample below is analyst-written and anonymised for illustration — structure and depth mirror our real deliverables; figures and names are not from any client engagement.
 Illustrative · Growthifye-prepared
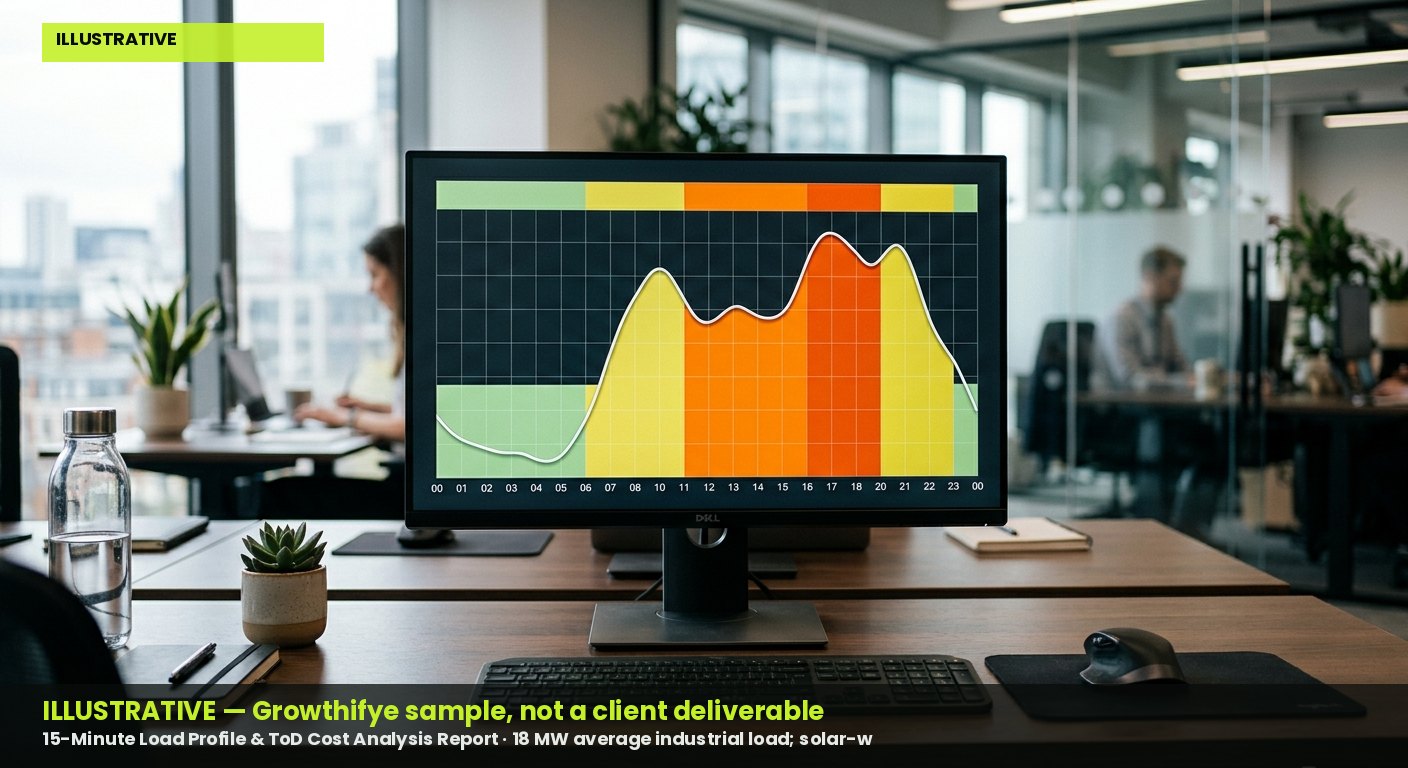
15-Minute Load Profile & ToD Cost Analysis Report
Statistical breakdown of load behaviour across seasons and tariff slabs, identifying peak-shaving and arbitrage windows with quantified rupee impact.
Sample excerpt · Load Profile Summary (Illustrative) — illustrative figures
| Parameter | Value |
| Average Load | 18.2 MW |
| Peak Load (evening ToD) | 24.6 MW |
| Load Factor | 0.68 |
| Peak ToD Tariff | Rs 9.80/kWh |
| Off-peak ToD Tariff | Rs 5.10/kWh |
| Annual ToD Peak Exposure | Rs 4.3 Cr |
- Based on 15 months of anonymised interval data
- Tariff figures illustrative, mapped to a generic Western India DISCOM ToD order
 Illustrative · Growthifye-prepared
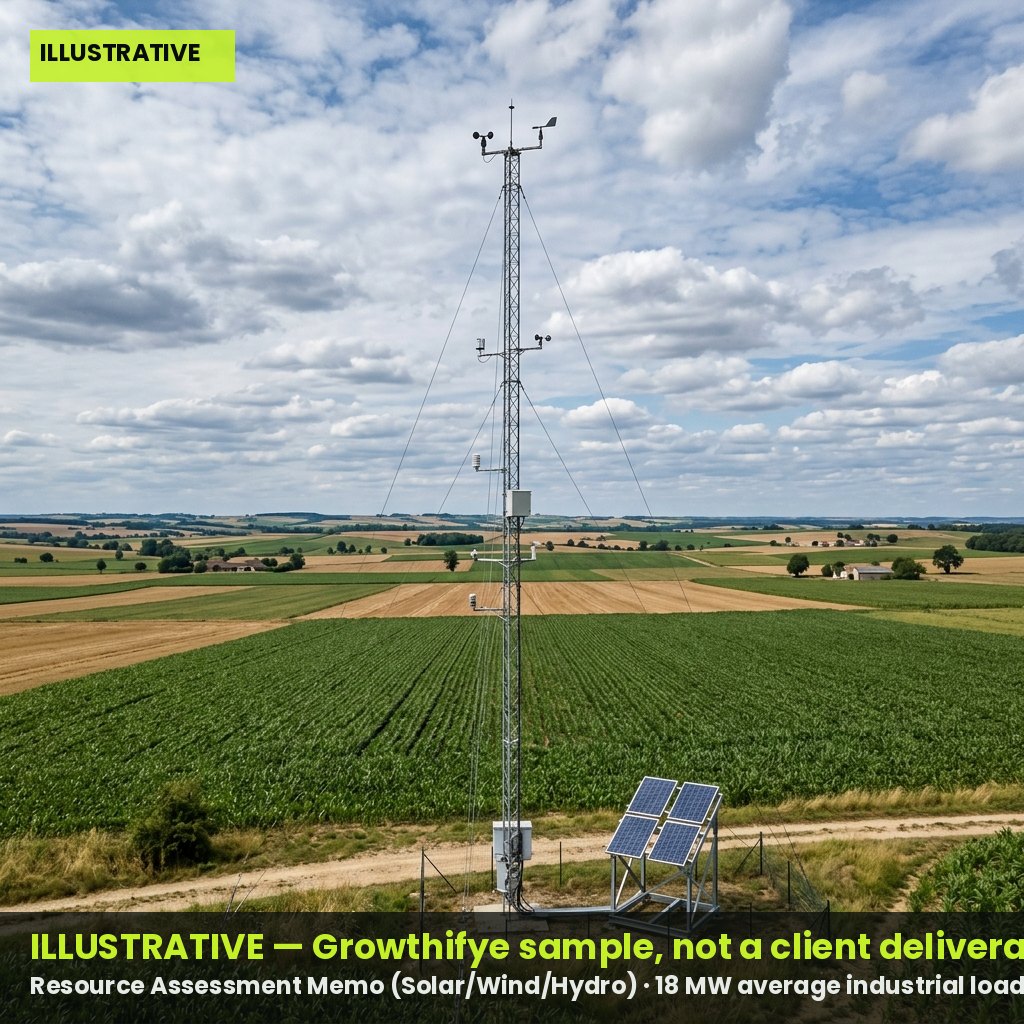
Resource Assessment Memo (Solar/Wind/Hydro)
P50/P90 yield estimates derived from satellite irradiance data, wind mast records or flow-duration curves, benchmarked against nearby reference stations.
Sample excerpt · Resource Yield Estimate Summary — illustrative figures
| Resource Type | P50 Yield | P90 Yield | Data Source |
| Solar (GHI-based) | 1,650 kWh/kWp/yr | 1,520 kWh/kWp/yr | Satellite + 1 ground station |
| Wind (80m hub height) | 26% CUF | 21% CUF | 12-month mast data |
| Small-hydro (run-of-river) | 42% CUF | 35% CUF | 10-yr flow duration curve |
- P90 used for conservative financial modelling in next stage
- Wind data subject to mast height correction and shear analysis
Opportunity Quantification Dashboard
Interactive summary comparing self-consumption, export and storage arbitrage scenarios against the client's actual cost of power, sized for a preliminary go/no-go decision.
Sample excerpt · Opportunity Sizing Matrix (Illustrative) — illustrative figures
| Scenario | Indicative Capacity | Est. Annual Saving |
| Solar-only, captive | 12 MWp | Rs 5.8 Cr |
| Solar + BESS (2-hr) | 12 MWp / 8 MWh | Rs 8.1 Cr |
| Hybrid Solar-Wind + BESS | 12 MW + 6 MW / 10 MWh | Rs 10.4 Cr |
- Figures indicative only, pending detailed sizing in next step
- Assumes current ToD tariff structure remains stable for 3 years
Outcomes
- Clear, data-backed view of the actual (not assumed) RE/storage opportunity size
- Quantified ToD arbitrage and peak-shaving potential in rupee terms
- Validated resource yield estimates (P50/P90) ready for bankable sizing
- A defensible go/no-go basis before committing to detailed concept design and CAPEX planning
Questions clients ask
What if we don't have 12 months of interval data?
We can work with shorter datasets supplemented by DISCOM records, nearby reference sites, and statistical extrapolation, though confidence bands will be wider until a full annual cycle is captured.
Do you install monitoring equipment as part of this step?
Where ground-truth data is missing, we can recommend and help procure temporary pyranometers, wind masts or flow loggers, though this is typically scoped as an add-on with lead time of 4-8 weeks.
How does this step feed into sizing and RTC/FDRE modelling?
This analytics stage produces the validated load and resource inputs that directly drive the next step's capacity sizing, storage duration and round-the-clock/firm dispatchable energy modelling.