Sourcing strategy
Choosing the Right Sourcing Route: Captive vs Group-Captive vs Open Access
Once demand is quantified, the critical decision is how to structure ownership and offtake. We model captive (26% equity), group-captive pooling, and third-party open access against landed cost, regulatory exposure, banking/wheeling risk, and balance-sheet impact — so the sourcing route is chosen on evidence, not convention.
Typical duration · 4–6 weeks, run in parallel with final demand-study sign-off
Samples generated 05 Sept 2026, 11:27 pm ISTWhat happens in this step
- 01Map applicable state regulations (open access rules, CSS/wheeling/banking charges, captive consumption norms) for each site under consideration
- 02Build landed-cost stacks for captive, group-captive, and third-party OA routes using current and projected tariff, surcharge, and loss assumptions
- 03Assess equity/funding implications of the 26% captive consumption threshold and group-captive pooling structures
- 04Quantify regulatory and counterparty risk for each route — surcharge escalation, connectivity delays, discom litigation history, developer credit strength
- 05Stress-test each option against tariff order changes, banking restrictions, and curtailment scenarios over the contract tenor
- 06Score options on a weighted matrix combining cost, risk, control, and balance-sheet treatment
- 07Present a recommended sourcing route with supporting sensitivity analysis for management sign-off
What we need from you
- Finalised demand profile and load centres from Step 01 (Demand Study)
- State(s) of consumption and applicable open access/captive regulations
- Client's balance-sheet appetite for equity investment (captive/group-captive)
- Existing power purchase agreements and their expiry/exit terms
- Corporate risk tolerance and preferred contract tenor
- Any group-company load available for pooling under group-captive structure
- Sustainability/RE100 or internal carbon targets influencing structure preference

Worked example (anonymised, illustrative)
60 MW Aggregated Industrial Load — Sourcing Route Evaluation · 60 MW contracted demand across two manufacturing sites (auto-components and textiles) · Karnataka and Maharashtra, India
A multi-site industrial group evaluating a wind-solar hybrid supply against captive equity investment, a pooled group-captive structure with a sister unit, and a pure third-party open-access PPA.
Sample deliverables from this step
Every sample below is analyst-written and anonymised for illustration — structure and depth mirror our real deliverables; figures and names are not from any client engagement.
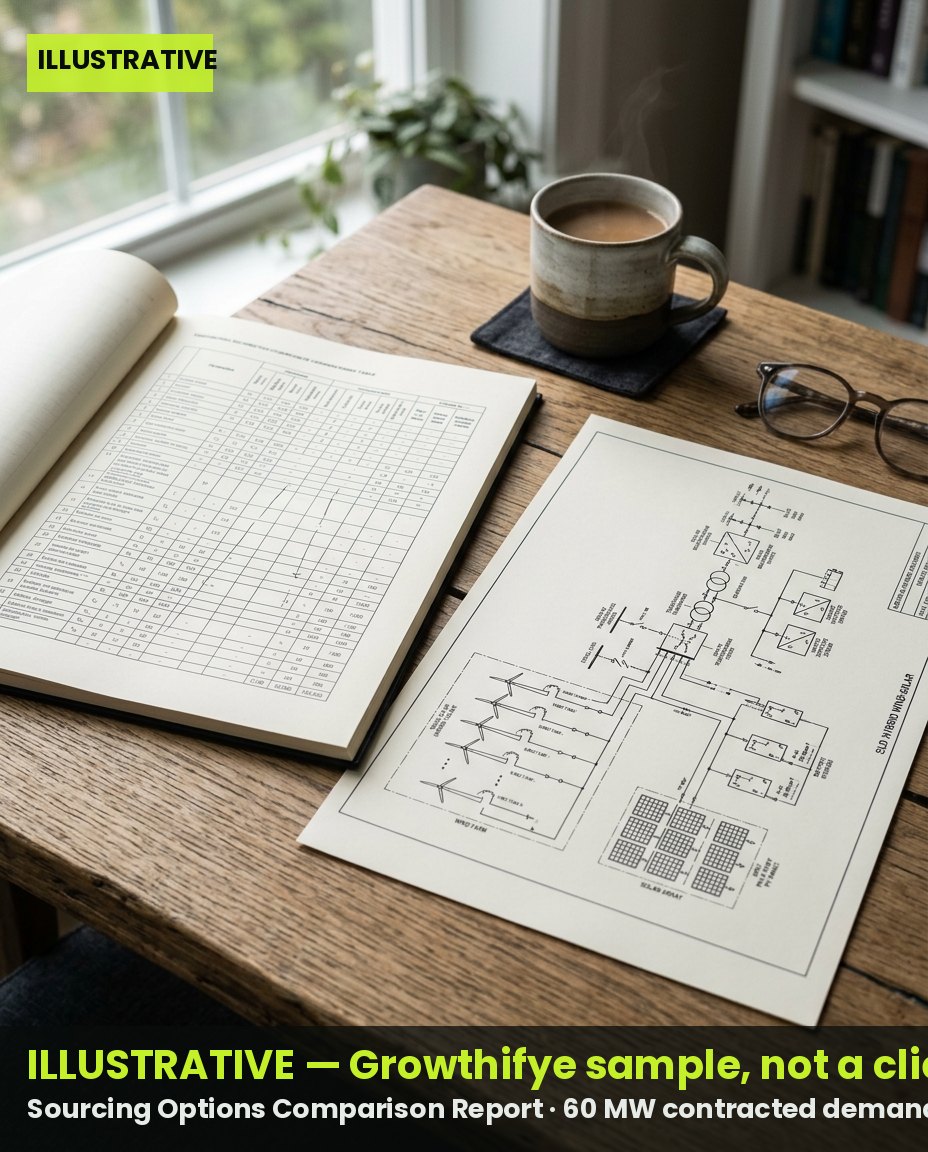 Illustrative · Growthifye-prepared
Sourcing Options Comparison Report
Side-by-side evaluation of captive, group-captive, and third-party OA routes on landed cost, risk, and control, with a recommended structure.
Sample excerpt · Landed Cost & Risk Summary — Illustrative (₹/kWh) — illustrative figures
| Parameter | Captive (26% equity) | Group-Captive (pooled) | Third-Party Open Access |
| Landed cost (₹/kWh, Yr1) | 3.35 | 3.52 | 3.68 |
| Equity commitment | ₹42 Cr (26% of project cost) | ₹18 Cr (pooled share) | Nil |
| CSS exposure | None (captive exemption) | None (captive exemption) | ₹0.85–1.10/kWh, escalable |
| Banking flexibility | Monthly, per state rules | Monthly, shared pool | Monthly, subject to discom discretion |
| Counterparty risk | Self (developer EPC risk only) | Shared across group entities | Developer credit + discom risk |
| Balance sheet impact | Capex on-book | Partial on-book | Off-book (opex only) |
- Cost figures are illustrative, based on FY24 tariff and surcharge assumptions
- CSS trajectory modelled per current state tariff order; subject to future escalation
- Recommendation weighted 60% cost, 25% risk, 15% control per client mandate
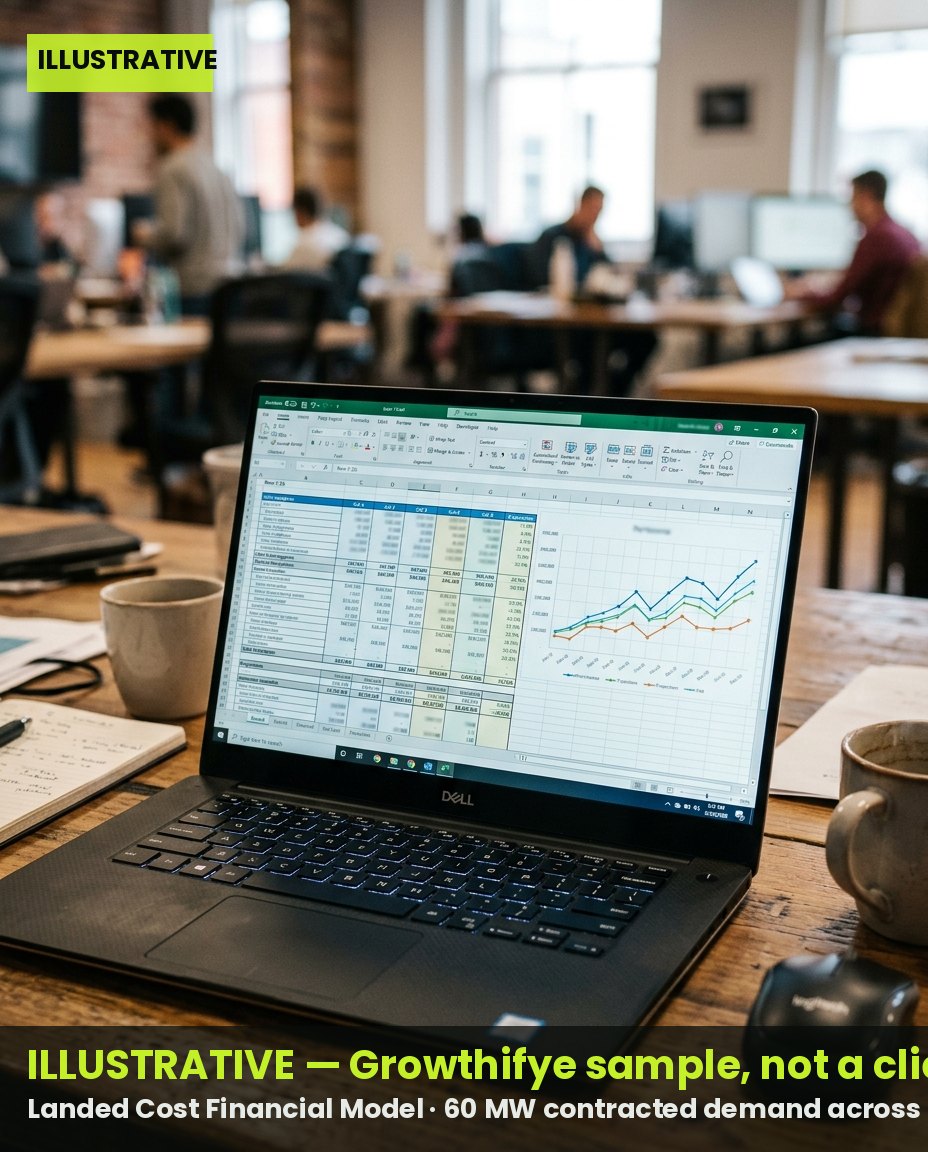 Illustrative · Growthifye-prepared
Landed Cost Financial Model
Editable cost-build model showing generation cost, transmission/wheeling, losses, CSS, and O&M for each sourcing route over a 20-year tenor.
Sample excerpt · Landed Cost Build-up — Group-Captive Wind-Solar Hybrid (₹/kWh) — illustrative figures
| Cost component | Year 1 | Year 5 | Year 10 |
| Generation cost (levelised) | 2.95 | 2.95 | 2.95 |
| Transmission & wheeling charges | 0.28 | 0.31 | 0.36 |
| Banking loss (adjustment) | 0.09 | 0.10 | 0.11 |
| O&M pass-through | 0.05 | 0.06 | 0.07 |
| Group-captive pooling overhead | 0.15 | 0.15 | 0.15 |
| Total landed cost | 3.52 | 3.57 | 3.64 |
- Model built with adjustable tariff, degradation, and surcharge escalation toggles
- Delivered in Excel with locked assumptions tab for audit trail
Regulatory & Risk Memo
State-wise regulatory risk assessment flagging exposure specific to each sourcing route, with mitigation recommendations.
Sample excerpt · Key Regulatory Risk Flags by Sourcing Route — illustrative figures
| Risk item | Captive | Group-Captive | Third-Party OA | Mitigation |
| 26% consumption norm breach | Medium | Medium-High | N/A | Load monitoring protocol, MoU clause |
| Surcharge order revision | Low | Low | High | Fixed-escalation PPA clause |
| Connectivity/evacuation delay | Medium | Medium | Medium | Early transmission application |
| Discom litigation history | Low | Low | Medium-High | Site selection screening |
| Banking curtailment risk | Low | Low | Medium | Diversified generation mix |
- Assessment based on public regulatory orders and precedent cases in the two states reviewed
- Not a substitute for legal opinion; recommend independent counsel review before signing
Sourcing Decision Dashboard
Weighted scoring matrix summarising all evaluated routes against client-defined criteria, used for management decision sign-off.
Sample excerpt · Weighted Scoring Matrix — Sourcing Route Selection — illustrative figures
| Criteria | Weight | Captive score (/10) | Group-Captive score (/10) | Third-Party OA score (/10) |
| Landed cost | 40% | 8.5 | 7.8 | 6.9 |
| Regulatory risk | 25% | 8.0 | 7.5 | 5.5 |
| Balance-sheet impact | 20% | 5.0 | 6.5 | 9.0 |
| Implementation speed | 15% | 6.0 | 6.0 | 8.0 |
| Weighted total | 100% | 7.3 | 7.2 | 7.1 |
- Weights agreed with client's finance and sustainability teams prior to scoring
- Dashboard delivered as an interactive workbook for scenario re-weighting
Outcomes
- A data-backed sourcing route selection aligned to cost, risk, and balance-sheet objectives
- Clear visibility of the equity/funding commitment required before committing to captive or group-captive structures
- A defensible risk register to support internal governance and board approval
- A shortlisted structure that becomes the basis for the competitive process in Step 03
Questions clients ask
How is the 26% captive consumption rule relevant here?
Under Indian electricity rules, a captive plant requires at least 26% equity holding by the consuming entity and consumption of at least 51% of generated power by the same entity/group. We model the exact equity outlay this implies and compare it against pooled or third-party alternatives.
Why does third-party open access often show a lower headline tariff but a higher landed cost?
Third-party PPAs typically quote an energy tariff only. Once cross-subsidy surcharge, wheeling charges, and banking losses are added, the landed cost can exceed captive or group-captive routes despite a lower base tariff — our model makes this comparison explicit.
Can the sourcing strategy change after signing an initial PPA?
Switching routes mid-tenor is possible but often costly due to exit clauses, stranded equity, or regulatory re-approval requirements. We stress-test the chosen route against future load and tariff scenarios precisely to minimise this risk before contracting.