Demand study
Demand Study: Precision Load Profiling to Right-Size Your Green Power Mix
Before sourcing a single megawatt of renewable power, we build a granular picture of your consumption. Using interval meter data, time-of-day (ToD) tariff exposure and site-level RE-fit potential, we quantify exactly how much solar, wind, hybrid or round-the-clock power your load can absorb — avoiding both under-contracting (grid dependency) and over-contracting (banking losses, DSM penalties).
Typical duration · 3-4 weeks
Samples generated 05 Sept 2026, 11:27 pm ISTWhat happens in this step
- 01Collect 12-24 months of 15-minute interval consumption data across all connection points and voltage levels
- 02Build load duration curves and seasonal/monthly demand heat-maps to identify base, peak and trough patterns
- 03Map ToD tariff slabs against actual consumption to quantify current ToD arbitrage losses
- 04Run RE-fit simulations overlaying solar-only, wind-only and hybrid generation profiles against the load curve
- 05Assess captive/group-captive eligibility, open-access feasibility and banking regulations for the host state
- 06Size the optimal RE capacity mix (MW) and contract structure (firm, must-run, peak-shaving) with sensitivity ranges
- 07Present findings with a recommended sourcing envelope to carry into the next stage
What we need from you
- 12-24 months of interval-level (15-min) energy consumption/meter data for all sites
- Latest electricity bills showing ToD slabs, contract demand and tariff category
- Site single-line diagrams and connected load / sanctioned load details
- Any existing PPA, group-captive or open-access agreements currently in force
- Expansion or capacity-addition plans for the next 3-5 years
- Sustainability targets (RE100, science-based targets, internal RE% mandates) if applicable

Worked example (anonymised, illustrative)
Multi-site auto-component manufacturer, load aggregation study · 42 MW aggregated contract demand across 6 plants · Western India
Manufacturer sought to raise RE share from 18% to 60%+ across a multi-state manufacturing footprint with varying ToD tariffs and shift patterns.
Sample deliverables from this step
Every sample below is analyst-written and anonymised for illustration — structure and depth mirror our real deliverables; figures and names are not from any client engagement.
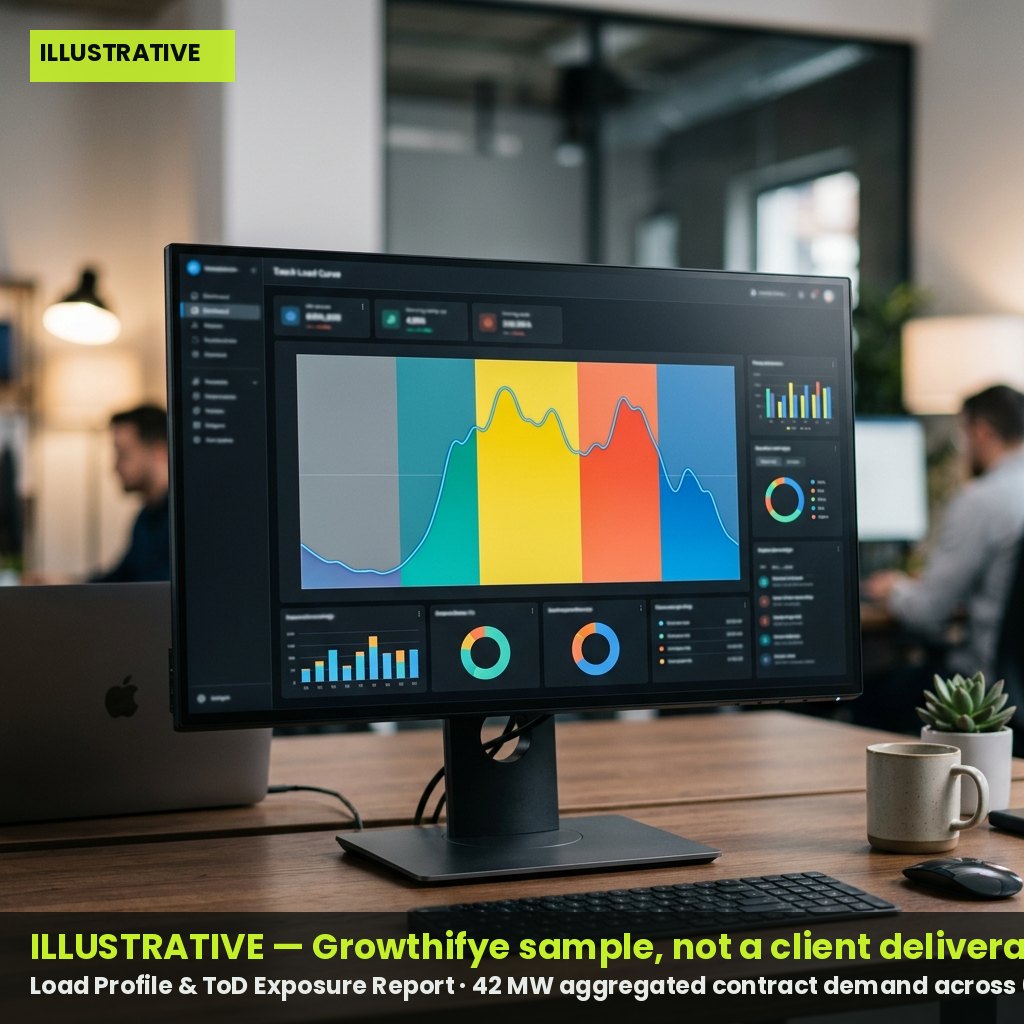 Illustrative · Growthifye-prepared
Load Profile & ToD Exposure Report
Detailed analysis of consumption patterns, seasonal variation and current ToD tariff losses, forming the evidence base for sourcing decisions.
Sample excerpt · ToD Consumption Summary (Illustrative) — illustrative figures
| ToD Slab | Hours | Avg Load (MW) | Tariff (Rs/kWh) | Monthly Units (MU) |
| Peak | 18:00-22:00 | 9.8 | 9.20 | 1.18 |
| Normal | 06:00-18:00 | 7.2 | 7.10 | 6.48 |
| Off-Peak | 22:00-06:00 | 5.1 | 5.40 | 3.06 |
| Solar hours | 09:00-17:00 | 7.5 | 7.10 | 4.80 |
| Weighted Avg | 24h | 6.9 | 7.05 | 10.72 |
- Peak-slab exposure identified as primary cost driver for RE hybridisation
- Solar-hour overlap of 62% supports strong solar-first mix
 Illustrative · Growthifye-prepared
RE-Fit Sizing Model
Interactive capacity-mix model testing solar, wind and hybrid combinations against the load curve to optimise self-consumption and minimise grid draw.
Sample excerpt · Capacity Mix Sensitivity Grid (Illustrative) — illustrative figures
| Scenario | Solar (MW) | Wind (MW) | RE Share (%) | Grid Draw (MU/yr) |
| Solar-only | 35 | 0 | 48% | 56.2 |
| Wind-only | 0 | 28 | 41% | 63.8 |
| Hybrid 60:40 | 22 | 15 | 58% | 45.1 |
| Hybrid + storage | 22 | 15 | 68% | 34.6 |
| Base case (current) | 8 | 0 | 18% | 88.4 |
- Hybrid + storage scenario shortlisted for next-stage sourcing strategy
- Storage sizing kept indicative pending tariff discovery in Step 3
RE Sourcing Envelope Memo
Concise recommendation memo defining target MW range, structure options (captive/OA/group-captive) and key regulatory flags for the chosen state(s).
Sample excerpt · Recommended Sourcing Envelope (Illustrative) — illustrative figures
| Parameter | Recommendation |
| Target RE capacity | 38-45 MW (solar-wind hybrid) |
| Structure | Group captive (26% equity route) |
| Contracted RE share target | 60-65% of annual consumption |
| Banking provision needed | Yes - monthly banking preferred |
| States in scope | 2 of 6 plant states cleared for OA |
- Two plant locations flagged for open-access regulatory constraints
- Envelope to be validated against developer bids in sourcing strategy stage
Outcomes
- Clear, data-backed target capacity range and RE mix before entering the market
- Quantified current ToD losses translated into avoidable cost opportunity
- Reduced risk of over/under-contracting in the eventual PPA
- A validated regulatory and structural pathway (captive/OA/group-captive) per site
Questions clients ask
What if we don't have 12 months of interval data?
We can work with 6 months of data supplemented by DISCOM billing records and seasonal extrapolation, though accuracy improves with a full annual cycle covering summer and monsoon demand swings.
Does this study commit us to a specific technology or developer?
No. This stage is technology-agnostic — it only defines the optimal capacity envelope and structure. Technology and developer selection happens in the sourcing and competitive process stages.
Can the study cover multiple sites across different states?
Yes, we routinely aggregate multi-site loads and flag state-wise open-access or captive eligibility differences within a single consolidated report.