Revenue Protection Analytics for Indian DISCOMs 2026: Smart Meter Data to Cash
By Sudarshan Karweer · sudarshan@growthifye.com · +91 84510 99371 (Call / WhatsApp) · 2026-09-18
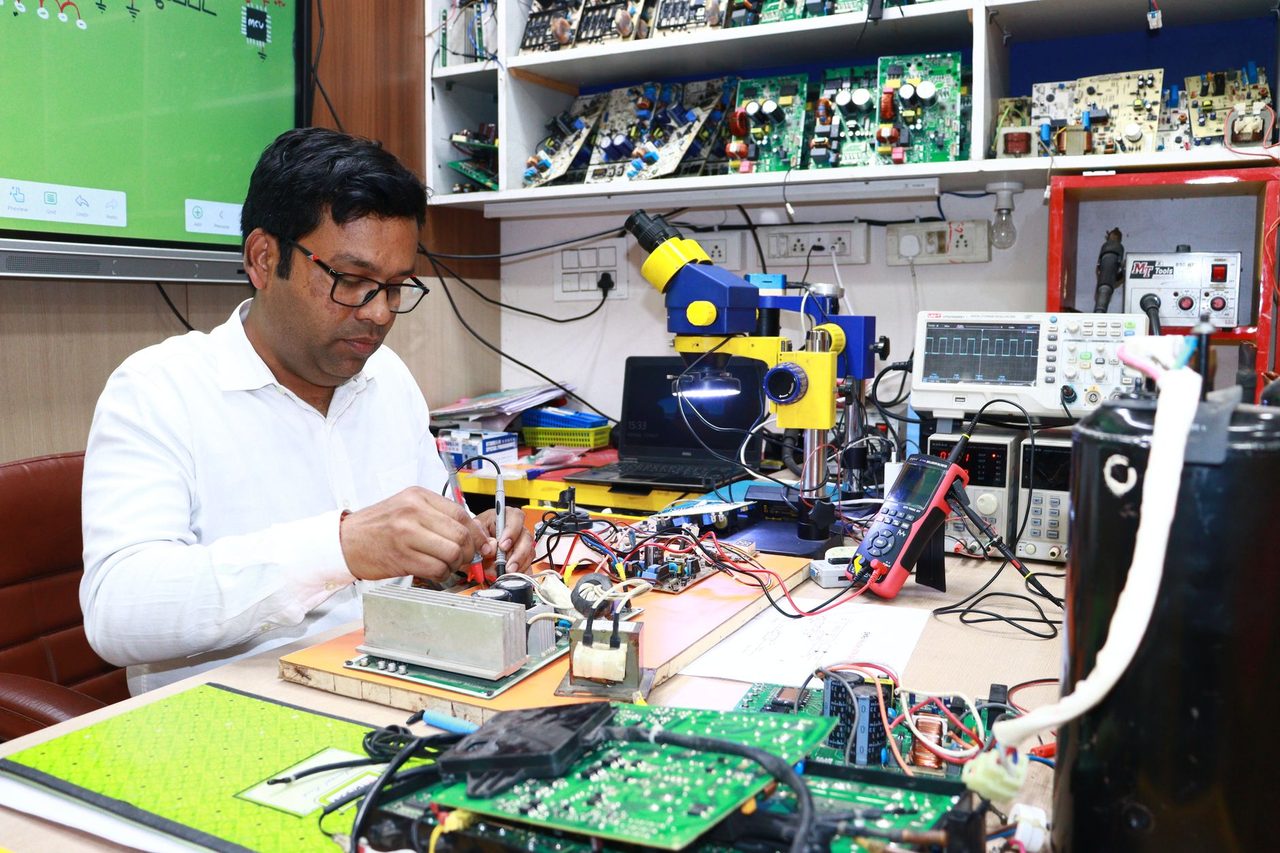
Photo: Multitech Institute on Pexels
India’s smart metering narrative in 2026 is shifting from meter rollout counts to cash realisation. Many DISCOMs now have lakhs of smart meters under RDSS-linked programmes, yet boardrooms are asking a harder question: where is the measurable improvement in billed energy, collections efficiency and loss reduction?
The answer is that AMI hardware by itself is not a revenue-protection strategy. The real gains come when interval data, tamper events, outage logs, billing exceptions, feeder input and field-service workflows are stitched into a closed-loop operating model. That model can identify theft, meter bypass, CT/PT manipulation, zero-consumption anomalies, billing misses, disconnected-but-live services and collection leakage far earlier than legacy monthly meter reading ever could.
For Indian C&I consumers, developers, lenders and policymakers, this matters because DISCOM cash flow directly affects payment security, open-access settlement quality, network capex capacity and bankability across the power value chain. A utility that improves revenue assurance can fund system upgrades faster, pay generators on time and support cleaner, more digital distribution operations.
This article looks at revenue protection analytics as the next distinct value pool in utility digitalisation for India in 2026, especially in the context of RDSS, prepaid migration, feeder metering and high-loss urban and peri-urban circles.
Why revenue protection is now a separate strategic priority
AT&C reduction has long been a utility goal, but revenue protection deserves separate treatment because it sits at the intersection of technical systems, commercial controls and field enforcement. A DISCOM may reduce outage duration or improve billing timeliness while still losing substantial revenue through theft, meter tampering, unbilled supply and weak exception handling.
Three changes make 2026 different:
- Smart meter penetration is high enough in several states to enable statistically meaningful pattern detection.
- RDSS has pushed utilities to think beyond procurement toward measurable operational outcomes.
- Data platforms are maturing, allowing event correlation across AMI, billing, GIS, feeder meters and consumer indexing.
In many Indian urban circles, even a 1-2 percentage point improvement in realised revenue can be material. Consider a DISCOM division handling 1,500 MU annual energy sales with an average billing realisation of Rs 6.2 per kWh. If analytics-led interventions recover just 1% additional billable and collectible energy, the annual impact is about Rs 9.3 crore. At 2%, it becomes Rs 18.6 crore. Across large circles and state-wide deployments, the business case becomes large enough to justify stronger data engineering, MDM tuning and field enforcement processes.
For C&I consumers, better revenue assurance can also reduce indiscriminate tariff pressure over time. When theft and billing leakage reduce, the burden of cross-subsidising unrecovered energy is less severe than in a system where honest paying consumers carry a larger share.
What revenue protection analytics actually includes
Revenue protection is often misunderstood as a simple tamper-alarm dashboard. In practice, effective programmes combine several layers of analytics and control.
- Consumption anomaly detection: sudden drops, flat loads, repeated zero-consumption periods, night-load inconsistencies, load factors inconsistent with sanctioned load or business type
- Tamper event analytics: neutral disturbance, magnetic influence, terminal cover open, current reversal, bypass signatures, meter outage patterns linked with suspicious restoration
- Billing assurance checks: missing reads, estimated billing repetition, incorrect multiplication factor, tariff-code mismatch, dormant accounts, disconnection status mismatch
- Energy accounting correlation: feeder input versus consumer aggregation, DT-level balance, phase-wise mismatch, abnormal technical loss baselines
- Collection-risk scoring: prepaid recharge irregularity, post-paid ageing, selective non-payment despite consistent usage, high-value account volatility
- Field action workflows: auto-generated inspection orders, photo evidence capture, geotagging, sealing records, legal-case tracking and recovery follow-up
The critical point is that analytics must not end at “alert generation”. Utilities that produce thousands of unprioritised alarms usually overwhelm field teams and lose credibility internally. The best-performing programmes score, rank and route cases based on expected recovery value, confidence level, consumer category, safety risk and legal enforceability.
This is where Vendor-neutral specifications matter. If a DISCOM is procuring analytics capability within a broader AMI or digitalisation package, it should avoid proprietary lock-in that makes downstream integration with billing, GIS, MDM and enterprise workflow tools expensive or slow.
The Indian DISCOM use cases with the fastest payback
Not every analytics use case delivers equal value. In India, 2026 priorities are increasingly clear.
1. High-value C&I anomaly detection
A relatively small number of HT and large LT commercial accounts can account for a disproportionate share of recoverable leakage. For these consumers, 15-minute or 30-minute interval patterns are highly useful.
Examples include:
- A commercial complex showing stable occupancy but a 35% drop in evening demand over two billing cycles
- A manufacturing unit with sanctioned demand unchanged but persistent near-zero load on one phase
- A hotel with DG usage patterns inconsistent with declared grid consumption during normal supply conditions
For such categories, each successful case may recover lakhs rather than thousands of rupees. Utilities commonly prioritise these accounts because field inspection costs are low relative to potential revenue recovery.
2. DT and feeder energy-balance exception management
Where consumer indexing and DTR metering are reasonably clean, analytics can identify pockets where billed energy diverges sharply from energy input. This does not replace broader AT&C programmes; instead, it pinpoints where inspection teams should go first.
For example, if a DT supplies 180 consumers and monthly input energy suggests losses of 38% in an urban zone where technical losses should be closer to 8-12%, that transformer becomes a priority cluster. Once smart-meter intervals are mapped, the utility can isolate suspicious consumers faster.
3. Prepaid revenue leakage controls
Under smart prepaid models, leakage shifts from meter reading errors to recharge behaviour, meter-status handling and exception cases. Utilities need controls for:
- meters communicating but not decrementing expected balances correctly
- supply restoration after low-balance events without valid recharge
- inactive accounts with persistent consumption signatures
- vending channel reconciliation gaps
Given the scale of smart prepaid deployment under current state plans, these controls can materially improve cash conversion.
4. Billing determinant validation
A surprising amount of revenue loss still comes from basic data quality: wrong contract demand, inaccurate meter constants, faulty TOD mapping, incorrect category assignment or billing-system exceptions that remain unresolved for months. Analytics can catch these faster than manual audits.
For large C&I accounts, a contract-demand or TOD billing error can have recurring monthly impact. In states with industrial tariffs commonly in the Rs 6.5-8.5 per kWh range and demand charges that can exceed Rs 300 per kVA per month, determinant errors can become significant quickly.
The technology stack DISCOMs need in 2026
Most utilities do not need a flashy standalone platform. They need a disciplined data architecture that converts AMI and enterprise signals into field action.
A practical stack includes:
- Smart meters and communication network with acceptable read success and event reliability
- Head-end system and MDM capable of interval validation, event normalisation and device-health tracking
- Integration with billing, CRM, GIS, outage systems and payment/vending platforms
- Analytics layer for anomaly scoring, energy accounting and case prioritisation
- Mobile workforce application for inspections, evidence capture and closure codes
- Recovery and legal workflow tracking integrated with commercial teams
Data quality is the first gating factor. If daily read success is consistently weak, event timestamps are unreliable or consumer indexing is incomplete, revenue-protection analytics will generate noise. In many Indian deployments, a realistic threshold for scaled analytics is sustained communication/read performance above roughly 85-90% for targeted consumer segments, with stronger expectations for HT and high-value LT accounts.
Utilities also need governance around model tuning. A tamper event in isolation should not automatically trigger disconnection or a punitive field visit. It should be correlated with consumption drop, feeder conditions, historical patterns and site category. False positives are costly because they consume workforce time and can create consumer disputes.
This is where FAT to SAT discipline becomes commercially important, not just technically important. Utilities and implementation partners should validate event mapping, exception handling, billing integration and field closure logic before full-scale rollout, rather than discovering process breaks after lakhs of meters are live.
How RDSS and policy frameworks support the business case
RDSS has created the capex push for metering and loss-reduction infrastructure, but the opex and governance model still determine whether savings are realised. Revenue protection analytics fits well within the broader RDSS logic because it links digital infrastructure to measurable AT&C and collection outcomes.
In 2026, state regulators and utility management teams are increasingly focused on demonstrable KPIs rather than broad digital claims. Useful revenue-protection KPIs include:
- billed energy increase in targeted feeder or DT clusters
- reduction in zero-consumption active connections
- reduction in repeat estimated bills
- tamper-case closure rate within 7, 15 or 30 days
- recovery value per 1,000 inspections
- prepaid exception resolution time
- collection efficiency improvement by consumer segment
For lenders and policymakers, these KPIs are superior to meter-installation counts because they show whether digital capex is converting into improved utility cash generation. That, in turn, affects debt service comfort, state subsidy dependence and the pace at which utilities can invest in network strengthening and clean-energy integration.
There is also a growing interface with open access, rooftop solar and prosumer billing. As more consumers adopt behind-the-meter solar, battery systems and more complex tariffs, billing assurance becomes more important. Revenue-protection systems should therefore be designed to accommodate future integration with DER management systems and advanced settlement logic, even if the immediate use case is theft and billing leakage reduction.
ROI math: what a realistic Indian business case looks like
Revenue-protection ROI should be assessed circle by circle, not through a generic national assumption. The main variables are consumer mix, baseline loss levels, tariff, collection efficiency, read success and field execution capability.
A simplified example:
- Urban division annual input energy: 2,000 MU
- Baseline aggregate billing and collection leakage addressable by analytics-driven interventions: 1.5% of input energy
- Average net realisable tariff: Rs 6.0 per kWh
- Gross annual recoverable value: 30 MU x Rs 6.0 = Rs 18 crore
Now assume:
- first-year actual capture of addressable value: 45%
- annual realised gain: about Rs 8.1 crore
- software, integration, field workflow and analytics operating cost: Rs 2.5-3.5 crore equivalent for the division-scale programme
This still leaves a healthy payback profile, especially where the programme is layered onto existing AMI infrastructure rather than built from scratch. In higher-loss circles or segments with concentrated C&I irregularities, payback can be much faster.
The caveat is execution. If inspection orders are not acted on, legal recovery is slow, billing corrections are delayed or MDM data is not trusted, the theoretical ROI never reaches the P&L. That is why utilities should treat this as a business process transformation, not an IT dashboard purchase.
Implementation mistakes to avoid
Several common mistakes are visible across Indian deployments.
- Treating all tamper alarms as equal instead of using risk-based prioritisation
- Running analytics without clean consumer indexing to feeder and DT levels
- Failing to integrate billing exceptions and payment data, which hides commercial leakage
- Measuring success by number of alerts generated rather than recovered revenue
- Ignoring field-team design, closure codes and legal documentation workflows
- Procuring black-box tools without clear data ownership or export capability
- Launching state-wide programmes before piloting models on high-value circles
A better approach is phased execution:
- select 2-4 circles with good AMI data quality and a mix of HT, commercial and high-loss urban feeders
- baseline billing, collection and tamper metrics for 3-6 months
- configure use-case-specific models and field workflows
- measure recovery value, false-positive rates and closure times
- refine thresholds before scaling
For utilities already investing in SCADA / ADMS integration or broader digital network programmes, revenue protection should not sit in isolation. Commercial analytics and grid operations data can reinforce each other. For instance, outage-aware billing validation can prevent misclassification of suspicious low consumption during genuine supply interruptions.
Why this matters beyond DISCOM balance sheets
Revenue protection is often framed narrowly as anti-theft enforcement, but its economic significance is broader. Better cash realisation improves payment discipline across the electricity value chain. It supports vendor confidence, strengthens utility borrowing capacity and reduces the need for blunt tariff escalations that hit compliant consumers and industry.
For renewable-energy developers and lenders, healthier DISCOM finances improve counterparty quality. For C&I consumers, cleaner billing and fewer systemic leakages can support more predictable power costs and better service investments. For policymakers, analytics-led revenue assurance is one of the few digital interventions that can show relatively fast and measurable gains if implemented well.
In 2026, the next frontier in utility digitalisation is not simply adding more endpoints. It is monetising the data already being created. DISCOMs that convert smart-meter, feeder and billing data into a disciplined revenue-protection engine will be in a stronger position to fund modernisation, manage tariffs and integrate a more complex distributed energy future.
If your utility, investment platform or project team is evaluating smart-meter analytics, revenue assurance design or implementation governance, contact Growthifye’s advisory desk. We help clients structure practical digitalisation roadmaps, vendor evaluation, commercial business cases and execution frameworks for Indian power-sector conditions.
Explore Growthifye's related capabilities
This analysis connects directly to our advisory practice: IEC 61850 substation automation · FLISR & self-healing networks · DER management systems · SCADA / ADMS integration.
About the author

Chief Executive Officer, Growthifye — With over 23 years in management consulting, Sudarshan has taken businesses from concept to scale — building and scaling new-age digital and energy businesses.
- 23+ years in management consulting
- EY alumnus
- Led large-scale BESS programmes, capital raises and advisory mandates
Want this analysis applied to your project?
Talk to our team