Distribution Transformer Monitoring for Indian DISCOMs 2026: Sensors, Analytics and ROI
By Sudarshan Karweer · sudarshan@growthifye.com · +91 84510 99371 (Call / WhatsApp) · 2026-09-17
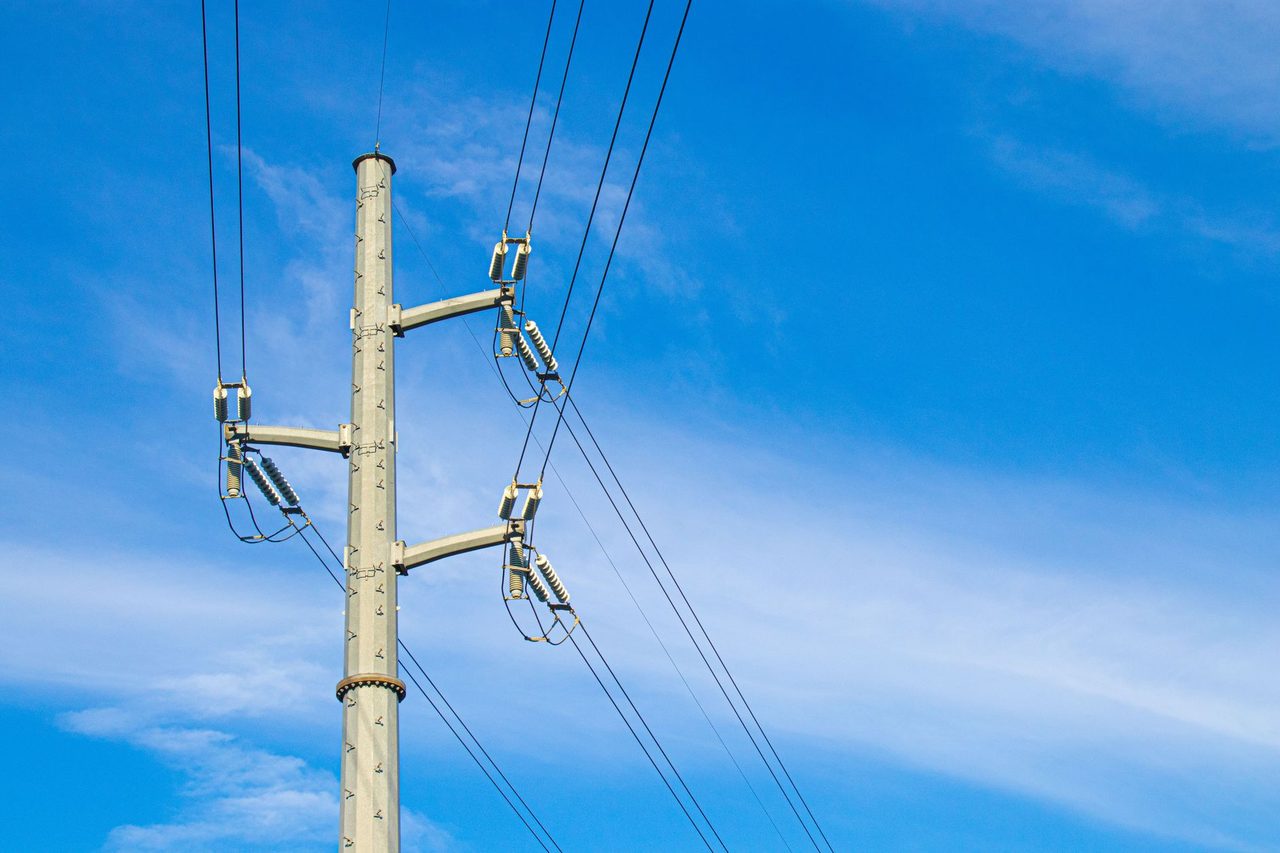
Photo: Aashish Rai on Pexels
Indian DISCOMs have spent the last few years discussing AMI, SCADA, ADMS, prepaid metering and outage automation. Yet one of the most under-utilised assets in the utility digital stack remains the distribution transformer (DT). In practice, a large share of technical stress, local reliability events, phase imbalance, overloading, low-voltage complaints and theft indicators show up first at the DT level, not at the state load dispatch centre and not always at the consumer meter.
For 2026, that makes distribution transformer monitoring one of the most practical next-step investments for Indian utilities implementing RDSS, scaling smart metering, and preparing for rooftop solar, agricultural feeder separation and EV charging growth. It is also highly relevant for C&I consumers, RE developers and lenders because DT performance increasingly affects supply quality, outage frequency, hosting capacity and utility loss trajectories.
This article looks at the business case for DT monitoring in India, the hardware and communications architecture that works in the field, where analytics create measurable value, and how DISCOMs can structure bankable deployments with clear ROI.
Why DT monitoring matters in India in 2026
A typical Indian distribution network still has uneven visibility below the 11 kV feeder. A utility may know feeder input energy reasonably well and may gradually improve consumer-level data through AMI, but the DT layer often remains a blind spot. That creates three operational problems.
First, the utility cannot see transformer loading and phase imbalance in near real time. In many urban and peri-urban areas, DT loading can swing sharply due to air-conditioning demand, mixed residential-commercial load and EV charging. In agricultural belts, seasonal and time-of-day peaks can push transformers into repeated thermal stress.
Second, failure response is still reactive. A burnt DT is replaced after complaints arrive, field teams are dispatched and stock is mobilised. The direct replacement cost is only part of the problem. The larger cost comes from outage duration, consumer dissatisfaction, damaged downstream equipment claims and repeat failures because the root cause was not addressed.
Third, energy accounting remains incomplete. If feeder metering is available and consumer metering is improving under RDSS, then the missing node for granular loss localisation is the DT. Once utilities can compare feeder inflow, DT-level energy and downstream billed energy, they can isolate pockets of abnormal technical losses, bypass, meter tampering, unauthorised extension and phase-wise imbalance much faster.
This is why DT monitoring now sits naturally alongside RDSS metering and distribution strengthening programmes. It is not a replacement for AMI or SCADA. It is the operational bridge between them.
What a practical DT monitoring architecture looks like
A field-ready DT monitoring system for Indian conditions should avoid over-engineering. The objective is not to turn every distribution transformer into a substation. The objective is to capture the minimum high-value dataset reliably and use it for operations, maintenance and loss reduction.
A typical DT monitoring package in 2026 includes:
- LT side three-phase voltage measurement
- Phase currents and neutral current measurement
- Apparent power, power factor and energy parameters
- Top-oil or enclosure temperature sensing where feasible
- Door-open, tilt or tamper alarms in theft-prone zones
- Optional oil level, winding temperature or gas indicators for higher-value urban assets
- Optional outage/restoration timestamping with event logs
- GPS or GIS coordinates for asset registry alignment
- Edge communications via RF mesh, 4G/5G, NB-IoT or hybrid telecom
For many DISCOMs, the highest-value starting point is not advanced dissolved gas analysis or premium sensors on every unit. It is reliable phase-wise current, voltage, outage status and energy data on the 20 percent of DTs that account for the largest share of failures, complaints or commercial loss suspicion.
Where AMI is already being rolled out, the DT monitor should integrate with the meter data and utility enterprise systems rather than becoming another silo. This is where Vendor-neutral specifications become critical. Many Indian deployments under legacy schemes suffered from device lock-in, proprietary protocols and weak interoperability. In 2026, utilities should insist on open APIs, event normalisation, cyber controls and integration-ready data models.
If the utility already has control centre modernisation underway, DT data should be designed to feed distribution operations and planning layers, not only a dashboard. In selected urban circles, the data can also complement SCADA / ADMS integration by improving the visibility of low-voltage network conditions beyond the feeder breaker.
The strongest use cases: failure prediction, phase balancing and theft analytics
Utilities often ask whether DT monitoring is justified beyond simple asset visibility. In Indian conditions, the answer is yes, but only if the deployment is tied to specific use cases and KPIs.
1. Failure prediction and maintenance planning
A burnt or repeatedly failing DT usually shows warning signatures before failure:
- Sustained overloading above nameplate or practical operating threshold
- Repeated evening or irrigation-driven peak stress
- High neutral current indicating load imbalance or network issues
- Chronic low voltage under load suggesting conductor or transformer stress
- Elevated temperature trends in summer months
- Frequent short-duration trips and restorations
Even basic analytics can classify DTs into low, medium and high failure-risk buckets. For a DISCOM replacing hundreds or thousands of failed transformers per year, a 10 to 20 percent reduction in failure incidence can produce substantial savings.
Indicatively, a 100 kVA to 250 kVA distribution transformer replacement including logistics, labour, oil, testing and outage handling can cost from around Rs 1.5 lakh to Rs 4 lakh depending on rating, utility standards and location. If a utility prevents 500 avoidable failures annually with better loading management and preventive action, the direct avoided cost alone may range from roughly Rs 7.5 crore to Rs 20 crore, excluding outage and consumer service benefits.
2. Phase balancing and voltage quality improvement
Many consumer complaints in India are still rooted in LT-side imbalance and poor local voltage management. A DT monitor can identify:
- Persistent phase overloading
- Underutilised parallel assets nearby
- n- Neutral stress and imbalance patterns
- Voltage sag pockets during peak hours
This allows the field team to execute low-cost corrective actions such as load shifting across phases, service connection rebalancing, conductor uprating in selected spans and transformer augmentation only where actually needed.
For C&I consumers connected downstream of stressed urban DTs, these actions matter. Repeated low-voltage conditions can affect motors, refrigeration loads, process equipment and DG set dependence. For state regulators and policymakers, better DT-level visibility supports a stronger evidentiary basis for supply quality improvements rather than only relying on aggregate feeder statistics.
3. Theft and unaccounted energy localisation
DT monitoring becomes especially powerful when paired with consumer metering and feeder metering. The logic is straightforward:
- Feeder input energy gives the upstream baseline
- DT energy isolates localised consumption blocks
- Consumer billed or metered energy reveals what is officially captured downstream
The delta cannot always be treated as theft because technical losses vary by conductor length, loading and LT network condition. But when a DT shows losses materially above modelled norms for its topology and season, the utility gets a precise investigation target.
In dense urban and semi-urban areas, this can sharply improve field inspection productivity. Instead of broad anti-theft drives with low hit rates, utilities can prioritise DT clusters with abnormal night load, unusual neutral current, sudden demand jumps or mismatch between consumer count and actual load profile.
In practical terms, even a 1 to 1.5 percentage point reduction in localised commercial loss across a high-loss urban division can justify a targeted DT monitoring programme. For a division handling Rs 300 crore of annual input energy, a 1 percent recovery improvement may translate to roughly Rs 3 crore per year, depending on tariff mix and billing realisation.
DT monitoring and RDSS: where the programme fit is strongest
RDSS has already created momentum around smart metering, feeder segregation, loss reduction and distribution infrastructure strengthening. But many utilities are discovering that meter rollouts alone do not fully solve local network visibility gaps. That is where DT monitoring fits.
The best RDSS-aligned applications are:
- Validation of loss reduction at feeder and DT granularity
- Support for consumer indexing and asset mapping clean-up
- Better planning of DT augmentation and B/C ratio evaluation
- Verification of agricultural versus non-agricultural demand behaviour
- Prioritisation of high-loss and high-failure pockets for capex
- Inputs for reliability baselining before automation upgrades
For utilities preparing future investments in FLISR & self-healing networks or DER management systems, DT telemetry also improves the quality of downstream network models. This becomes increasingly relevant as rooftop solar, small BESS and EV charging expand at the edge of the network. Without DT-level visibility, hosting-capacity studies and localised reliability planning remain weaker than they should be.
What ROI can DISCOMs realistically expect?
The ROI for DT monitoring depends heavily on targeting. Blanket deployment across every rural and urban transformer on day one may be hard to justify. A phased model generally produces better economics.
A practical business case in 2026 can be framed around four value buckets:
- Reduced transformer failure and maintenance cost
- Lower AT&C loss through better localisation and enforcement targeting
- Improved billing from corrected indexing and unmetered load discovery
- Better capex efficiency by avoiding unnecessary augmentation and prioritising the right assets
Indicative costs vary by sensor package, communications mode, enclosure standard, integration scope and analytics software. For planning purposes, a basic to mid-range DT monitoring setup may cost around Rs 20,000 to Rs 60,000 per DT at scale, while premium configurations can go higher. Integration with enterprise platforms, dashboards and analytics will add programme-level cost.
Suppose a DISCOM deploys 10,000 DT monitors in high-priority urban and mixed-load areas at an average all-in cost of Rs 35,000 per unit. The capex would be about Rs 35 crore, excluding some central system overheads. If the programme delivers:
- Rs 8 crore annual avoided failure and maintenance cost
- Rs 10 crore annual commercial recovery through loss localisation
- Rs 4 crore annual savings from better augmentation planning and field productivity
then annual quantified benefits could reach around Rs 22 crore. On that basis, simple payback may fall near 1.8 to 2.5 years depending on O&M and realised performance. Even if actual benefits are 25 to 30 percent below forecast, the economics can remain attractive for high-loss circles.
For lenders and policymakers, the key point is that DT monitoring is not merely an IT dashboard investment. It can be structured as an operational efficiency programme with measurable loss, reliability and asset-life outcomes.
Implementation pitfalls Indian utilities should avoid
Several deployments fail not because the sensors are wrong, but because programme design is weak. Common pitfalls include:
- No clean DT asset registry or poor GIS alignment
- Consumer indexing not mapped correctly to the transformer
- Communications chosen without field signal testing
- Too many parameters, too little actionable analytics
- Separate vendor portals with no enterprise integration
- No ownership between utility IT, operations and field maintenance teams
- No workflow to act on overload, imbalance or tamper alerts
- Procurement based only on lowest capex rather than lifecycle value
Utilities should treat this as an operational transformation programme, not a hardware purchase. That means pilot design, KPI definition, circle-wise targeting, field training, dashboard thresholds, cybersecurity controls and acceptance testing all matter. FAT to SAT discipline is especially important so that devices proven in factory conditions also perform reliably in heat, dust, monsoon and telecom-challenged field environments.
A phased roadmap that works for DISCOMs, developers and financiers
For 2026, the most credible deployment pathway is a phased roadmap.
Phase 1: prioritise 2,000 to 10,000 DTs in urban high-loss feeders, high-complaint zones, overloaded mixed-load pockets and areas with repeated transformer burnouts.
Phase 2: integrate DT data with consumer indexing, AMI and feeder metering to establish actionable energy accounting.
Phase 3: introduce predictive maintenance, load transfer recommendations and automated exception management.
Phase 4: use the validated data for network strengthening, rooftop solar hosting studies, EV load planning and advanced automation programmes.
This phased model is relevant beyond utilities alone. RE developers benefit because weak distribution pockets often constrain distributed solar and storage interconnection. C&I consumers benefit through more stable local supply conditions and fewer voltage complaints. Lenders benefit because the utility’s operational data improves confidence in distribution modernisation outcomes and capex prioritisation.
The broader lesson is simple: India’s next layer of utility digitalisation cannot stop at billing systems, feeder dashboards or substation control rooms. The distribution transformer is where technical stress, consumer service quality and local commercial leakage become visible in a form that utilities can act upon quickly.
In 2026, DISCOMs that build this DT intelligence layer well will be better positioned to reduce failures, sharpen RDSS outcomes, support distributed energy growth and improve the credibility of their loss-reduction narratives with regulators and financiers.
If your utility, lending team or project platform is evaluating DT monitoring, loss analytics or broader distribution digitalisation, contact Growthifye’s advisory desk for a practical assessment of architecture, specifications, deployment phasing and ROI.
Explore Growthifye's related capabilities
This analysis connects directly to our advisory practice: IEC 61850 substation automation · FLISR & self-healing networks · DER management systems · SCADA / ADMS integration.
About the author

Chief Executive Officer, Growthifye — With over 23 years in management consulting, Sudarshan has taken businesses from concept to scale — building and scaling new-age digital and energy businesses.
- 23+ years in management consulting
- EY alumnus
- Led large-scale BESS programmes, capital raises and advisory mandates
Want this analysis applied to your project?
Talk to our team