Feeder Metering and DT Monitoring for AT&C Loss Reduction in India 2026
By Sudarshan Karweer · sudarshan@growthifye.com · +91 84510 99371 (Call / WhatsApp) · 2026-08-25

India’s utility digitalisation conversation in 2026 is often dominated by smart meters, SCADA, ADMS and DER integration. But for many DISCOMs, especially outside dense urban circles, the fastest route to measurable AT&C loss reduction is still more basic: reliable feeder metering, distribution transformer monitoring, and disciplined energy accounting from grid substation to consumer category. Without this layer, utilities cannot separate technical loss from theft, cannot target capex correctly, and cannot produce bankable evidence for regulators, lenders or programme administrators under RDSS.
For C&I consumers, renewable-energy developers, lenders and policymakers, this matters because the quality of a DISCOM’s field data increasingly shapes tariff trajectories, grid-hosting capacity, payment discipline, outage management and the pace at which open access and distributed energy resources can scale. A feeder that is unmetered, incorrectly metered, or poorly reconciled at the DT level can hide 10% to 25% loss pockets that later surface as higher wheeling charges, delayed payments, network constraints or poor reliability for industrial consumers.
This article focuses on a different but critical angle within utility automation: feeder metering and DT monitoring architecture for Indian DISCOMs in 2026, including how to design the data stack, where the economics work, what policy frameworks apply, and how utilities can turn meter data into actionable AT&C reduction.
Why feeder and DT-level visibility is the missing middle in many Indian DISCOMs
India has made major progress in consumer indexing and smart metering under RDSS, but the operational gap between substation energy inflow and consumer billing remains large in many states. In practice, utilities often know how much energy leaves a 33/11 kV or 66/11 kV substation, and they increasingly know what selected consumers are billed. What is missing is a dependable layer in between:
- 11 kV outgoing feeder metering with time-synchronised interval data
- Distribution transformer metering and health monitoring
- Accurate GIS mapping of consumers to feeders and DTs
- Consumer category tagging by agriculture, domestic, C&I and public loads
- Monthly and ideally daily energy balance by feeder and DT
This middle layer is where hidden technical and commercial losses usually sit. In mixed-load geographies, a feeder may carry agricultural pumping, small industry, domestic villages and public water works on the same line. If DT mappings are weak, a DISCOM cannot determine whether elevated losses come from overloaded conductors, defective meter installations, unbilled connections, theft-prone pockets, or simply poor asset tagging.
For regulators and lenders, this is not a theoretical issue. AT&C losses still vary sharply across utilities and circles. In 2026, well-performing urban circles may operate below 10% to 12%, while weaker areas in some states still remain above 20% and in stressed pockets significantly higher. Even a 1 percentage-point reduction in loss level can create substantial annual value for a medium-to-large DISCOM. For example, if a utility purchases 20,000 MU annually at an average power purchase cost of Rs 5.2 per kWh, a 1% loss reduction is worth roughly Rs 104 crore per year before considering improved billing and collection effects.
The 2026 policy and funding context: RDSS, regulators and utility reform priorities
The Revamped Distribution Sector Scheme remains the central framework shaping metering and system strengthening in 2026. While public discussion often focuses on prepaid smart metering, RDSS also supports distribution infrastructure modernisation, feeder segregation in relevant contexts, and improved monitoring systems that enable accountability on losses and reliability.
Three policy realities are shaping project decisions this year.
First, utilities are under pressure to demonstrate measurable outcomes rather than equipment installation counts. Simply installing feeder meters is no longer enough. State governments, DISCOM boards and funding institutions increasingly ask whether meter data is being reconciled, whether exceptions are tracked, and whether the utility can prove reduction in input-output gaps.
Second, state electricity regulatory commissions are paying closer attention to true-up petitions, loss trajectories and capital expenditure prudence. Where a DISCOM cannot demonstrate feeder-wise or DT-wise results, regulators are less likely to accept broad loss-reduction claims. This affects tariff proceedings and future investment approvals.
Third, digitalisation is becoming linked to payment security, reliability and integration of distributed resources. As rooftop solar, group captive structures, BESS and EV loads increase, utilities need more granular visibility at feeder level to understand reverse power flow windows, daytime demand depression and transformer stress.
For C&I consumers, this policy shift matters because a better-measured network generally leads to more credible wheeling loss allocations, faster energy accounting for open access users, and stronger justification for targeted network upgrades rather than across-the-board tariff pressure.
What a practical feeder metering and DT monitoring architecture looks like
A workable 2026 architecture for Indian DISCOMs does not require a full ADMS-grade deployment on day one. It requires a layered design that can scale.
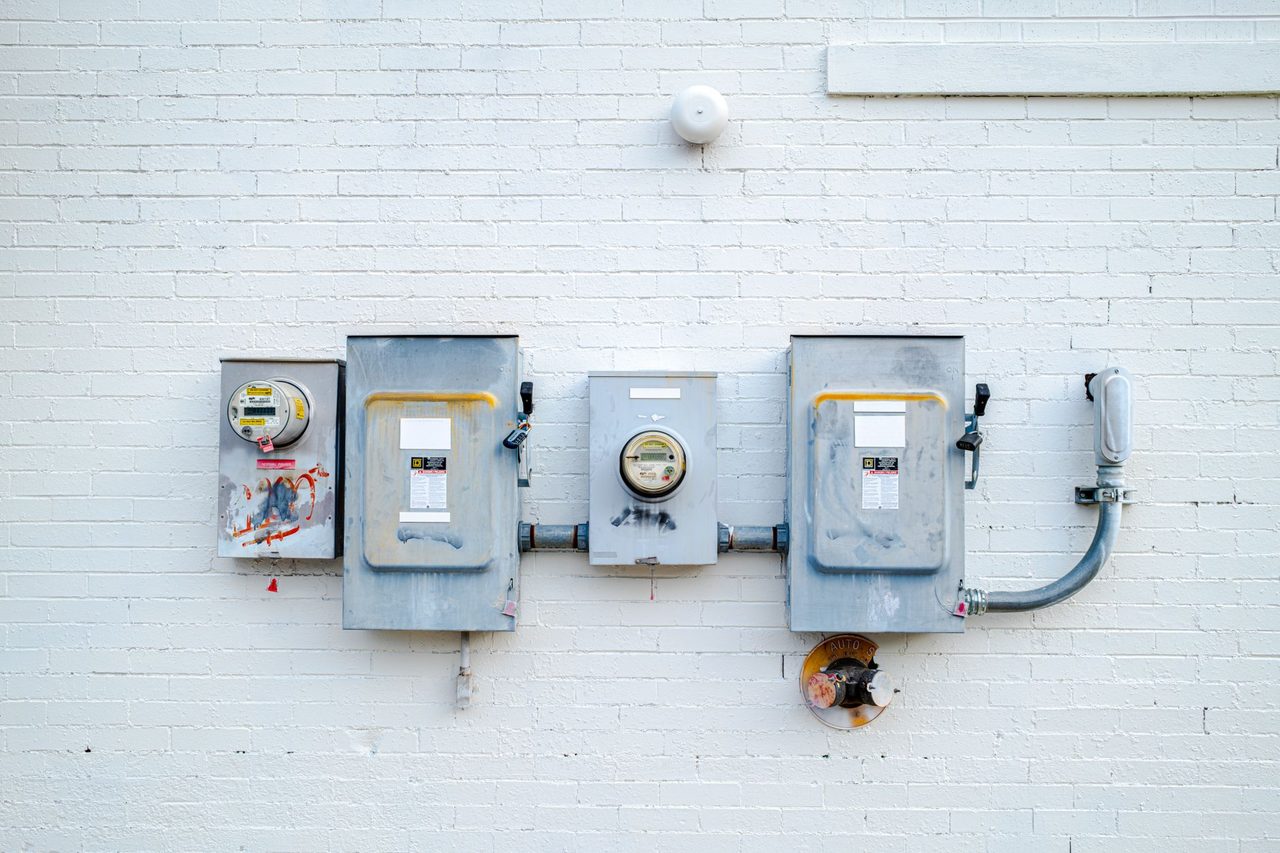
At the feeder level, a DISCOM should typically deploy:
- ABT-compliant or equivalent high-accuracy feeder meters at all 11 kV outgoing feeders from primary substations
- Tamper/event capture and interval data, ideally 15-minute blocks
- GPS or network time synchronisation for better reconciliation with substation boundary meters
- Dual communication options where telecom uptime is poor, such as RF/cellular fallback combinations
- Automated exception flags for no-data, flat-line profiles, CT/PT anomalies and sudden step changes
At the DT level, the design should include:
- Metering of distribution transformers, prioritised first for high-loss, high-load and high-revenue areas
- Voltage, current, energy and power factor measurement
- Oil temperature or hotspot proxies where asset-health integration is planned
- DT code, feeder code and consumer-index linkage inside a common data model
- Phase-level visibility in theft-prone or heavily unbalanced segments
On the software side, the minimum stack should include:
- Head-end system or data concentrator integration
- Meter data management functions for validation, estimation and editing
- Feeder and DT energy accounting dashboards
- GIS-linked consumer indexing
- Exception workflow engine for field teams
- APIs to billing, outage, asset and finance systems
A common failure in Indian projects is buying metering hardware before cleaning network master data. If feeder naming differs across substation records, billing systems, GIS files and maintenance logs, the utility will spend months reconciling data manually. Growth-stage utilities should therefore start with data governance: feeder IDs, DT IDs, consumer mapping, meter hierarchy and location accuracy.
Where the economics work: how utilities and financiers should evaluate these projects
Feeder metering and DT monitoring projects are usually justified on loss reduction, but that alone understates the business case. A better evaluation framework in 2026 includes five value buckets.
- Reduction in energy theft and unbilled consumption through area targeting
- Reduction in technical losses by identifying overloaded lines, poor power factor and phase imbalance
- Improvement in billing quality via consumer-index correction and feeder-wise anomaly detection
- Lower O&M cost through focused patrols instead of blanket inspections
- Better capex prioritisation for reconductoring, DT augmentation and feeder bifurcation
Consider a simple example. A DISCOM circle handles 1,200 MU annual energy input with reported AT&C losses of 24%. If improved feeder and DT energy accounting helps the utility identify and correct just 3 percentage points of recoverable losses over 18 to 24 months, and average realised revenue is Rs 5.8 per kWh, the annual gain is roughly:
- 1,200 MU x 3% = 36 MU recovered
- 36 million kWh x Rs 5.8 = about Rs 20.9 crore per year
Even after allowing for phased recoverability and collection leakages, this often supports attractive payback if deployment is well targeted. In urban and industrial circles, payback can be under 24 months in high-loss pockets. In rural areas, returns depend more on feeder mix, agriculture subsidy structures and field enforcement capability.
Lenders and project-finance evaluators should ask for:
- Baseline feeder-wise and circle-wise input energy for at least 12 months
- Consumer category mix and average billing efficiency
- Existing meter coverage and communication uptime
- Governance model for theft enforcement and field action
- Regulatory treatment of capex and loss trajectory assumptions
- KPI-linked implementation milestones, not only procurement milestones
The strongest projects are not necessarily the biggest. They are the ones that focus first on the top 10% to 20% feeders and DT clusters that contribute a disproportionate share of losses or revenue leakage.
Implementation pitfalls Indian DISCOMs still face in 2026
Despite years of digitisation programmes, several predictable issues continue to weaken outcomes.
The first is poor consumer indexing. If billed consumers are not accurately mapped to the right DT and feeder, the utility may conclude that a DT has 35% loss when half the issue is simply bad mapping. Before analytics, the index must be cleaned.
The second is communication underperformance. Many feeder metering projects promise near-real-time data but deliver patchy uploads because telecom surveys were weak, antenna placement was poor, or power supply to communication equipment was not stabilised. A feeder meter with 60% data availability is operationally weak; utilities should aim for sustained availability above 95%, and for critical urban feeders even higher.
The third is absence of field-response discipline. Digital flags do not reduce losses by themselves. If a system marks repeated zero-consumption patterns, meter bypass signatures or DT overload trends, but there is no SLA for site verification, the business case collapses.
The fourth is lack of integration with planning and finance. Feeder data should guide annual capex decisions. If a feeder repeatedly shows high evening voltage drop and DT overloading, that should influence conductor upgrade or augmentation budgets. Too often, metering remains in one IT silo while engineering planning happens elsewhere.
The fifth is unrealistic analytics ambition at phase one. Some utilities start with AI-heavy procurement language before they have complete meter hierarchy, timestamp consistency or validated asset IDs. In most cases, a rule-based exception engine and basic daily energy balance produce more value in year one than advanced modelling built on weak data.
How C&I consumers, RE developers and policymakers should read feeder-level data trends
This topic is not only for DISCOM engineers. Stakeholders across the power value chain should pay close attention to feeder and DT-level monitoring because it changes how network quality and commercial risk are assessed.
For C&I consumers:
- Feeder-level visibility can support better outage diagnostics and power-quality interventions
- Industrial estates on well-measured feeders are more likely to receive targeted upgrades
- Accurate energy accounting improves confidence in wheeling and distribution loss computations relevant to open access users
- High-loss mixed feeders may face more inspections, operational restrictions or delayed approvals for additional load
For RE developers:
- Rooftop solar, behind-the-meter storage and group captive projects depend on local network hosting conditions
- Daytime backfeed patterns on industrial or commercial feeders can only be managed credibly when feeder metering is robust
- DT-level overload visibility helps identify where distributed solar plus storage can defer utility capex or reduce transformer stress
- Better utility data improves bankability discussions around curtailment risk and grid availability
For policymakers and regulators:
- Loss reduction targets should distinguish between metering coverage and active energy accounting
- Feeder-wise reporting can improve subsidy transparency, especially where agricultural loads dominate
- Utilities should be encouraged to publish standardised reliability and loss metrics at circle or feeder category level
- Capex approvals can be linked to demonstrated use of measured feeder performance rather than generic network expansion claims
One important 2026 trend is the convergence of feeder analytics with subsidy reform and agricultural supply management. In states where farm consumption estimation has historically been weak, DT metering and feeder segregation data can materially improve subsidy claims and reduce disputes between DISCOMs and state governments. That has downstream importance for payment cycles and overall utility liquidity.
A 12-month action roadmap for DISCOMs and investors
A practical roadmap does not begin with statewide saturation. It begins with measurable control zones.
Months 1 to 3:
- Clean feeder, DT and consumer master data
- Freeze naming conventions and asset hierarchy
- Identify top loss-making and top revenue feeders
- Conduct communication and installation surveys
- Define baseline KPIs: input energy, billed energy, collection efficiency, DT overload incidence, data availability
Months 4 to 6:
- Install or replace critical feeder meters and priority DT meters
- Integrate data into a common dashboard with GIS references
- Start daily feeder energy balance and weekly DT exception review
- Train circle teams on exception closure workflows
Months 7 to 9:
- Launch enforcement and engineering interventions feeder by feeder
- Correct consumer mapping gaps and meter anomalies
- Prioritise reconductoring, DT augmentation or capacitor placement using measured evidence
- Link field team performance to closure rates and verified savings
Months 10 to 12:
- Validate first-round loss reduction and collection improvement
- Prepare regulatory and board reporting with feeder-level evidence
- Expand deployment to the next tranche of feeders based on proven ROI
- Integrate with outage and planning systems where data quality is mature
The key KPI set should be small and strict:
- Feeder meter data availability
- DT meter data availability
- Daily and monthly energy balance completion rate
- Feeder-wise AT&C loss trend
- Number of mapping corrections completed
- Revenue gain attributable to interventions
- O&M cost per resolved exception
In 2026, the utilities that succeed will not be the ones with the largest software procurement packages. They will be the ones that can answer simple operational questions every morning: Which feeders lost the most energy yesterday, which DTs are overloaded, which consumer clusters do not reconcile, and what field action is due today.
For India’s power sector, feeder metering and DT monitoring may appear less glamorous than advanced automation platforms, but they remain one of the most financeable and actionable foundations for utility reform. They create the evidence base for lower AT&C losses, better tariffs, stronger grid planning, improved open-access administration and more confident integration of distributed renewable energy.
If your utility, fund, developer platform or industrial energy team is evaluating feeder metering, DT monitoring, RDSS-linked loss-reduction programmes or utility digitalisation strategy, contact Growthifye’s advisory desk for project design, techno-commercial assessment, implementation support and lender-ready diligence.
About the author

Chief Executive Officer, Growthifye — With over 23 years in management consulting, Sudarshan has taken businesses from concept to scale — building and scaling new-age digital and energy businesses.
- 23+ years in management consulting
- EY alumnus
- Led large-scale BESS programmes, capital raises and advisory mandates
Want this analysis applied to your project?
Talk to our team