PMU and WAMS for RE Evacuation in India 2026: ISTS Visibility, Costs, Compliance
By Sudarshan Karweer · sudarshan@growthifye.com · +91 84510 99371 (Call / WhatsApp) · 2026-09-09
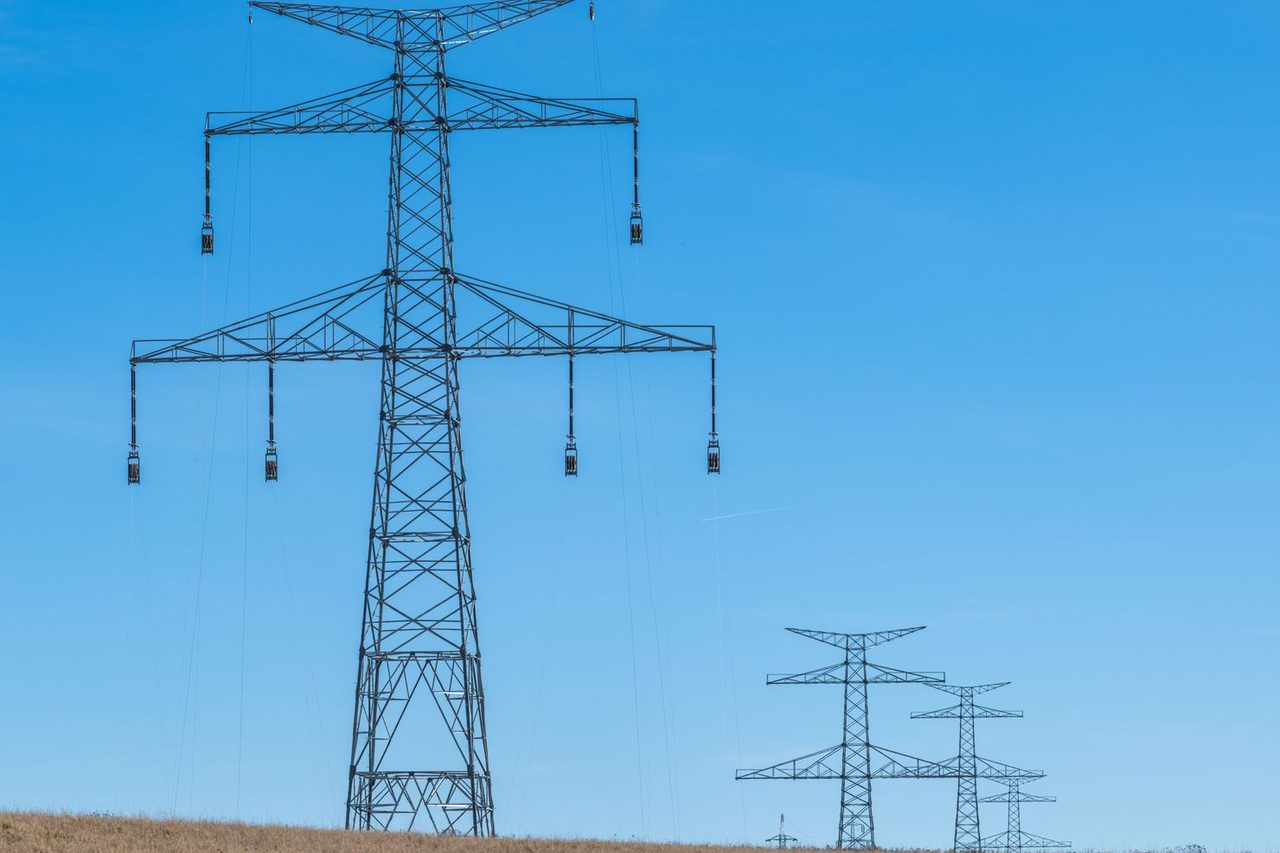
Photo: Petr Ganaj on Pexels
India’s renewable build-out is now limited less by generation ambition and more by the quality of transmission visibility. In 2026, that means phasor measurement units (PMUs), wide area measurement systems (WAMS), reliable time synchronisation, and real-time analytics are moving from a utility-only topic to a project-finance and evacuation-readiness issue.
For renewable energy developers, C&I consumers contracting large open-access portfolios, lenders funding utility-scale parks, and utilities integrating inverter-based resources, the question is practical: can the grid see emerging instability early enough to keep evacuation secure? In many corridors, especially those carrying solar-wind hybrids from resource-rich states into load centres, the answer increasingly depends on PMU density, data quality, and actionability.
This article looks at PMU and WAMS deployment for renewable evacuation in India in 2026: where they fit in ISTS and intra-state systems, how they support compliance, what they cost, and why they matter for curtailment risk, substation design, and power system planning.
Why PMU and WAMS matter for renewable evacuation in 2026
SCADA gives operators snapshots every few seconds. PMUs give time-synchronised measurements of voltage, current, frequency, phase angle and rate of change of frequency at much higher reporting rates, typically 25 to 50 frames per second in Indian transmission applications. That difference matters when inverter-heavy systems change state rapidly.
As India adds more renewable capacity under central and state schemes, several grid conditions are becoming more common:
- fast voltage fluctuations at pooling points and EHV buses
- angle separation across weak corridors during contingencies
- low-inertia frequency behaviour during high solar hours
- inter-area oscillations as renewable-rich regions export over long distances
- mismatch between scheduled injection and actual ramping during weather events
Traditional SCADA and post-event disturbance records are not enough for these conditions. WAMS integrates data from geographically dispersed PMUs so system operators can detect oscillations, monitor angular stability, validate models, improve remedial action schemes, and make better dispatch or switching decisions.
For renewable evacuation, this directly affects whether a corridor can run closer to its true secure limit instead of being derated conservatively. In practice, poor visibility often translates into higher operating margins, more constraints, and a greater probability of curtailment. Better visibility does not replace network strengthening, but it helps extract more reliable capacity from existing assets.
Where PMUs fit in ISTS, green energy corridors and substations
In India, PMU deployment has been evolving through national and regional initiatives led by central and state transmission utilities, load despatch centres and system operators. By 2026, the architecture increasingly spans:
- ISTS substations at 765 kV, 400 kV and critical 220 kV nodes
- renewable pooling substations and switching stations
- HVDC terminals and major generation evacuation nodes
- state transmission utility substations in green energy corridors
- key interconnection points between state and central networks
For renewable-heavy states such as राजस्थान, Gujarat, Tamil Nadu, Karnataka, Andhra Pradesh and Maharashtra, PMUs are especially valuable at buses that experience:
- high seasonal export swings
- weak-grid characteristics
- frequent topology changes due to bay outages or augmentation works
- concentration of inverter-based generation above 500 MW to 2 GW in local pockets
At the substation level, PMUs are typically installed alongside numerical relays, disturbance recorders, GPS or alternative time sources, bay-level metering, and communication gateways. In new transmission schemes, PMU readiness should be considered during HV/EHV substation design rather than added later as an afterthought. That reduces retrofit cost, panel rework, communication redesign and testing delays.
A practical design approach in 2026 is to prioritise PMU placement at:
- sending-end buses of renewable pooling stations
- receiving-end ISTS substations for major RE corridors
- buses adjacent to series-compensated lines or power-electronics-heavy nodes
- substations identified in planning studies as oscillation-sensitive
- corridors where GNA-linked injections materially change loading patterns
Compliance and policy context in India
PMU and WAMS deployment sits at the intersection of multiple regulatory and operational frameworks rather than a single standalone requirement. In 2026, the key context includes the Indian Electricity Grid Code framework, CEA technical standards, connectivity procedures, forecasting and scheduling obligations, and SLDC/RLDC/NLDC operating requirements.
For developers, the important point is that observability increasingly influences compliance outcomes even where PMU installation is not the only formal obligation. During connectivity and commissioning processes, system operators may expect high-quality disturbance visibility, event records, model validation support, and coordinated telemetry integration.
Relevant practical touchpoints include:
- CEA technical standards for connectivity to the grid
- Grid code provisions around frequency, voltage and disturbance response
- CERC connectivity and GNA-related procedures for network access and operational coordination
- SLDC and RLDC telemetry, metering and communication requirements
- cyber-security and communication redundancy expectations for critical infrastructure
Lenders are also more attentive to this area in 2026. On large evacuation-linked projects, due diligence now increasingly asks whether the substation and line package has adequate dynamic monitoring capability, especially where weak-grid conditions have already been flagged in studies. This is not theoretical. If post-commissioning performance issues occur, weak disturbance visibility can prolong root-cause analysis, delay full-load operation, and create disputes across generator, EPC, OEM and transmission interfaces.
Cost ranges, communication architecture and implementation timelines
The cost of PMU and WAMS deployment depends heavily on whether it is a greenfield installation in a new EHV substation or a retrofit in an operational node. It also depends on communication bandwidth, redundancy philosophy, control centre integration, analytics software and cyber-security hardening.
Indicative 2026 India cost ranges are as follows:
- PMU hardware at transmission-grade quality: roughly Rs 12 lakh to Rs 28 lakh per unit depending on channels, compliance features and vendor stack
- Time synchronisation equipment and redundancy: around Rs 2 lakh to Rs 8 lakh per location
- Panel integration, marshalling, engineering and testing: around Rs 4 lakh to Rs 15 lakh per bay or installation package depending on retrofit complexity
- Communication upgrades including fibre interface, routers, switches and cyber-security layers: around Rs 10 lakh to Rs 40 lakh per substation package
- Phasor data concentrator and control-centre software integration: project dependent, often Rs 1.5 crore to Rs 8 crore for multi-substation rollouts
- Annual O&M, software support and calibration allowance: often 5% to 10% of initial system cost
For a typical 400 kV renewable evacuation substation, an incremental PMU-ready design package may add a relatively small percentage to the total capex of the yard, often well below 1% of a full GIS or AIS substation project cost. Yet that small increment can materially improve event visibility and operational confidence.
Implementation timelines in 2026 typically look like this:
- engineering and specification finalisation: 4 to 8 weeks
- procurement and FAT: 8 to 16 weeks
- communication readiness and panel works: 6 to 12 weeks
- installation, SAT and control-centre integration: 4 to 10 weeks
In practice, the longest delays are usually not in PMU supply but in communication readiness, interface approvals and signal mapping with utility systems.
Use cases that matter to developers, utilities and lenders
PMU and WAMS value is strongest when translated into specific risk reductions. For renewable evacuation in India, the highest-value use cases in 2026 are the following.
- Oscillation monitoring in export corridors
As renewable-rich states export power over long distances, poorly damped oscillations can emerge after faults or switching events. PMU data helps operators identify oscillation modes and take informed action, whether through generation redispatch, network reconfiguration, or control tuning.
- Voltage stability monitoring near pooling hubs
High renewable concentration can create voltage-control stress, especially during low-load or high-reactive-power conditions. PMUs provide better situational awareness than standard SCADA for voltage-angle relationships and evolving instability signatures.
- Model validation for inverter-based resources
Many evacuation bottlenecks are worsened by mismatch between actual plant behaviour and assumed models. PMU event data improves validation of plant controllers, PPC settings, reactive response and ride-through behaviour. This is where Power system studies becomes more valuable when backed by field data rather than assumptions alone.
- Faster fault and disturbance diagnosis
When a trip or curtailment event occurs, parties often spend days debating whether the root cause was line fault, controller interaction, voltage excursion, protection setting or system weakness. PMU traces sharply reduce diagnosis time.
- Better transfer capability utilisation
Where operators have confidence in wide-area visibility, they can often operate closer to secure limits than in low-observability environments. This does not eliminate thermal or stability limits, but it can reduce hidden conservatism.
- Improved lender and offtaker confidence
For large projects dependent on specific transmission milestones, monitoring architecture is becoming part of operational due diligence. Better visibility supports lower perceived evacuation risk.
Design considerations for renewable evacuation projects
Developers often assume PMU decisions belong only to transmission utilities. That is too narrow a view. Even where the utility owns the wider WAMS platform, developers should account for phasor visibility in their evacuation interface planning.
A sound project approach should cover:
- whether the pooling substation or interconnection node has PMU coverage today
- whether new bays, bus sections or line reactors require additional channels
- the communication path to SLDC, RLDC or transmission owner systems
- interoperability with protection IEDs, disturbance recorders and SCADA gateways
- redundancy for time synchronisation and data communication
- cyber-security architecture and user access controls
- data retention, event playback and analytics ownership
This links closely with Protection, control & SCADA because poor signal architecture can undermine otherwise sound substation engineering. It also links with Connectivity & open access, since recurring congestion and curtailment concerns increasingly require evidence-backed discussions with utilities and offtakers.
For projects above roughly 300 MW, and especially for hybrid, storage-linked or multi-terminal evacuation arrangements, PMU-readiness should be reviewed during transmission interface design. For projects in weak-grid pockets or long radial evacuation stretches, the case is stronger.
What stakeholders should do in 2026
For developers:
- ask early whether the interconnection node has adequate phasor visibility
- include observability requirements in technical due diligence and EPC scope reviews
- use PMU-backed event analysis to close model and controller gaps before COD disputes escalate
For transmission utilities and system operators:
- prioritise PMU placement based on renewable concentration and stability sensitivity, not only voltage level
- integrate WAMS alarms with operating procedures, not just dashboards
- use phasor data in post-disturbance learning and corridor transfer reviews
For lenders and investors:
- examine whether evacuation risk assessments include dynamic observability, not just bay completion status
- test whether weak-grid concerns identified in studies are supported by monitoring plans
- require clarity on responsibility for communication, maintenance and event-data access
For policymakers:
- align renewable corridor planning with visibility infrastructure, not just conductors and transformers
- support standardisation of data formats, interoperability and cyber-secure sharing protocols
- encourage observability benchmarks in high-RE transmission schemes
India’s 2026 transmission challenge is no longer only about adding lines and substations. It is also about seeing the system clearly enough to use those assets safely and fully. PMUs and WAMS are therefore not niche digital add-ons. They are becoming core infrastructure for RE evacuation, stability management and bankable grid integration.
For sponsors and utilities, the business case is straightforward: a relatively modest investment in high-speed, time-synchronised visibility can reduce curtailment risk, improve disturbance handling, strengthen compliance readiness and support better use of scarce transmission capacity.
If your project is navigating ISTS connectivity, renewable pooling design, grid-readiness studies or substation observability planning, contact Growthifye’s advisory desk for practical support on transmission strategy, engineering and implementation.
Explore Growthifye's related capabilities
This analysis connects directly to our advisory practice: Power system studies · HV/EHV substation design · Transmission line engineering · Protection, control & SCADA.
About the author

Chief Executive Officer, Growthifye — With over 23 years in management consulting, Sudarshan has taken businesses from concept to scale — building and scaling new-age digital and energy businesses.
- 23+ years in management consulting
- EY alumnus
- Led large-scale BESS programmes, capital raises and advisory mandates
Want this analysis applied to your project?
Talk to our team