India 2026 Product Carbon Footprint Strategy for Exporters and Industrial Plants
By Sudarshan Karweer · sudarshan@growthifye.com · +91 84510 99371 (Call / WhatsApp) · 2026-09-13
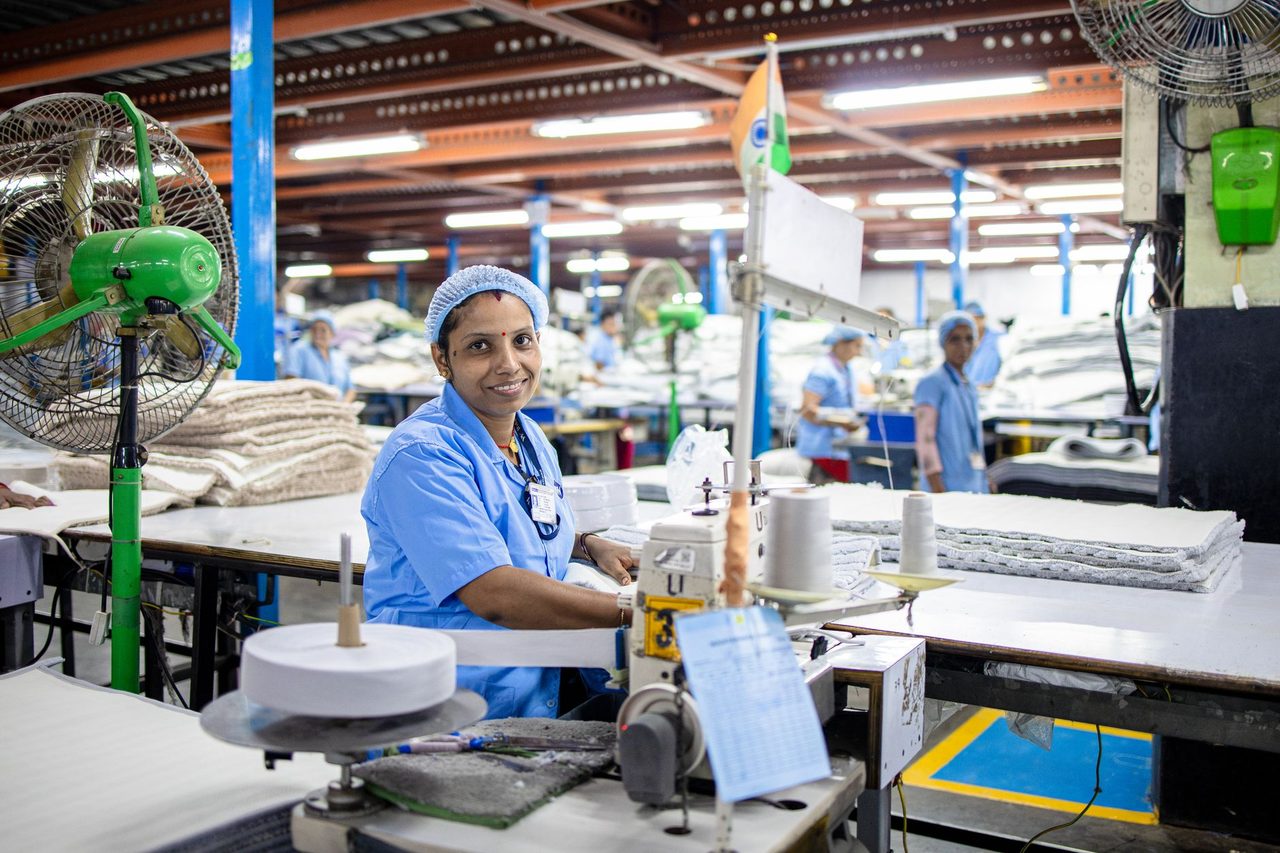
Photo: EqualStock IN on Pexels
Indian manufacturers are no longer being asked only for company-level emissions. In 2026, many are being asked for product-level emissions with clear calculation logic, plant boundaries, allocation rules and audit-ready supporting data. For exporters, this is now commercially material. For domestic suppliers to large OEMs, it is quickly becoming a procurement filter. For lenders and project sponsors, product carbon footprinting is becoming a proxy for transition readiness.
That creates a distinct challenge. A company may have reasonably mature Scope 1 and Scope 2 reporting, but still be unable to answer a basic buyer question: what is the emissions intensity of one tonne of my rolled steel coil, one tonne of clinker, one MWh-equivalent of industrial gas output, one tonne of specialty chemical, or one square metre of processed material? That gap matters because plant-level inventories do not automatically translate into product-level carbon data.
This article sets out a practical 2026 strategy for product carbon footprinting in India, with a focus on exporters, industrial plants, lenders and advisory teams building finance-ready decarbonisation plans. The angle is intentionally different from generic Scope 1/2/3 and CBAM coverage: the focus here is on plant-to-product carbon architecture, allocation discipline, data controls and how product-level numbers reshape capex priorities.
Why product carbon footprint matters in India in 2026
Three market forces are converging.
First, European and other international buyers increasingly want verified or at least methodologically robust product carbon data. Even where formal regulation does not yet mandate full product declarations across all sectors, commercial tenders often do. Suppliers with weak product-level data are losing time in qualification, discounting harder to defend assumptions, or getting pushed into lower-value pools.
Second, CBAM-related reporting discipline has changed the quality threshold for emissions data in traded industrial goods. Even where a plant is not directly exporting a covered good today, many firms sit upstream in the value chain and are being asked for primary data by their direct customers. A domestic intermediate supplier may discover that its emissions allocation method is now a customer issue, not only an internal accounting issue.
Third, decarbonisation capex decisions are becoming more granular. A board may know that the plant emits 0.9 tCO2e per tonne of output on average, but that is not enough to choose between a waste-heat recovery project, electric boiler replacement, biomass substitution, process control upgrade or renewable power procurement. Product carbon footprinting helps identify which process route, product mix and utility configuration carry the highest carbon burden and margin risk.
For Indian industry, this means PCF is no longer a branding exercise. It is an operating dataset.
Plant emissions are not the same as product emissions
A common mistake in industrial decarbonisation is to divide total annual plant emissions by total annual production and call that the product footprint. This can materially misstate carbon intensity when a site has:
- Multiple products with different process routes
- Shared utilities such as boilers, chillers, compressors or captive power
- Co-products and by-products
- Rework, scrap recycling or internal transfers
- Seasonal fuel switching
- Outsourced processing steps
- Purchased intermediates with varying embedded emissions
A correct product carbon footprint model has to move from legal-entity emissions to process-linked emissions and then to product allocation. That requires at least five design choices:
- Functional unit: per tonne, per piece, per litre, per square metre, per batch, etc.
- Boundary: cradle-to-gate, gate-to-gate or another clearly stated system boundary
- Time basis: monthly, quarterly or annual intensity with production normalisation rules
- Allocation method: mass, energy, economic value or process-specific causality
- Data hierarchy: metered primary data first, then engineering estimates, then secondary factors where necessary
For example, a chemicals site producing three grades from shared reactors and utilities cannot defend a simple average allocation if steam demand, residence time and yield loss vary sharply by grade. Similarly, a metals site running both primary and recycled feedstocks needs product-specific embedded input factors rather than one averaged raw-material number.
This is why product carbon footprinting often uncovers hidden data weaknesses in metering, batch tracking, utility accounting and ERP integration.
A practical 7-step PCF build for Indian industrial sites
The most effective PCF programs in 2026 are not built as one-time consultant spreadsheets. They are designed as recurring plant data systems. A workable seven-step sequence is below.
1) Define the commercial use case first
Start with why the PCF is needed.
- Buyer questionnaire or preferred supplier status
- Export compliance and trade exposure management
- Product pricing differentiation
- Internal decarbonisation planning
- Lender diligence for transition capex
This determines how rigorous the method, assurance and update frequency must be. A monthly internal shadow PCF may use some engineering allocations. A customer-facing declaration usually needs much tighter traceability.
2) Map product families to process routes
Do not begin with emissions factors. Begin with the process map.
- Raw-material receipt and storage
- Pre-processing and handling
- Core transformation steps
- Heat and steam use
- Electricity loads by line or department
- Onsite transport and material movement
- Finishing, packaging and dispatch
Plants with mixed production often discover that 20-30% of utility use is poorly assigned at line level. Installing or reconfiguring submeters can have very high value because it improves both carbon accounting and operational efficiency.
3) Build a primary-data hierarchy
For Indian C&I facilities, typical core data sources include:
- Fuel purchase and consumption records for coal, petcoke, furnace oil, diesel, LPG, LNG, PNG, biomass
- Captive generation logs and heat-rate data
- Grid electricity bills, open access schedules and renewable settlement statements
- Steam generation and condensate return records
- Production and batch records from MES or ERP systems
- Weighbridge data for inputs and outputs
- Laboratory and quality records for yield and moisture adjustments
Where measurement gaps exist, classify them explicitly. For example:
- Tier 1: direct metered data
- Tier 2: calibrated engineering calculation
- Tier 3: proxy estimate based on operating hours or rated load
- Tier 4: secondary database factor
The objective in 2026 should be to push material product-footprint drivers into Tier 1 or Tier 2 over 12-18 months.
4) Set allocation rules before seeing the results
Allocation is where credibility can fail. Decide ex ante how shared emissions will be assigned.
Useful principles include:
- Use direct causality where practical
- Use mass allocation only when products are physically comparable and process demand is similar
- Use energy allocation for heat- or energy-linked co-products where justified
- Use economic allocation cautiously because price volatility can distort trend analysis
- Separate unavoidable common services from process-variable loads
A site with captive steam and compressed air should avoid broad annual averaging if product campaigns differ significantly. Monthly or batch-based allocation may be more defensible.
5) Include upstream hotspots selectively but seriously
For many products, purchased materials dominate the footprint. This is especially true in metals, chemicals, packaging, engineered goods and some food processing chains. A gate-to-gate footprint may satisfy some internal use cases, but buyers often ask for cradle-to-gate views.
In practice, Indian firms should prioritise supplier-specific primary data for:
- High-volume feedstocks
- n- High-emission intermediates
- Imported materials with CBAM relevance or traceability demands
- Inputs with known process-route variation, such as recycled versus virgin content
Where supplier primary data is unavailable, use transparent secondary factors and maintain a replacement plan. This is where Carbon accounting & disclosure capability needs to be tied to procurement processes, not kept inside sustainability teams.
6) Create an MRV pack, not just a dashboard
A credible PCF system requires documentary evidence and version control.
At minimum, maintain:
- Boundary note and methodology statement
- Emission factor register with source dates
- Allocation rulebook
- Meter list and calibration status
- Reconciliation between plant totals and product totals
- Change log for assumptions and process modifications
- Review and approval workflow
This discipline matters for customer assurance, lender diligence and eventual alignment with carbon market or trade-related submissions.
7) Convert PCF into an abatement pipeline
Once the product footprint is built, use it to rank abatement by impact on the most exposed SKUs rather than the plant average alone. This often changes investment sequencing.
A low-cost power procurement change may sharply cut the footprint of electricity-intensive product lines. A steam trap and condensate optimisation package may matter more for one high-margin grade than for the entire site average. A feedstock shift may reduce one product footprint substantially while leaving total plant emissions only moderately changed.
That is why Net-zero roadmaps & MACC should increasingly be run at product-family level for export-oriented manufacturers.
What Indian cost and tariff realities mean for PCF strategy
In 2026, carbon reduction is judged against actual Indian energy economics, not generic abatement theory.
A few realities matter:
- Industrial grid tariffs in many states still sit roughly in the Rs 6.5-10.0/kWh range depending on demand category, voltage level, subsidy structure and time-of-day design.
- Open access renewable supply for large C&I buyers can still deliver landed savings versus grid in several markets, though banking, wheeling and cross-subsidy structures vary materially by state.
- Captive and group-captive structures remain relevant where duty and surcharge design support economics.
- PNG and LNG economics remain volatile by region and contract structure, affecting thermal decarbonisation pathways.
- Biomass availability and delivered cost remain highly location-specific, often determining whether thermal substitution is scalable.
- Electrification of low- and medium-temperature heat can be attractive where load factor, tariff design and process controllability align.
Why does this matter for product carbon footprinting? Because the lowest-cost abatement for the plant may not be the highest-value abatement for the product under buyer scrutiny. If Product A is highly electricity-intensive and sold into a carbon-sensitive export market, RE-led decarbonisation of that line may deserve priority even if another thermal project has a lower plant-wide payback.
Similarly, if a product footprint is dominated by purchased clinker, billet, resin or solvent, onsite utility optimisation alone will not move the commercial metric enough. Procurement strategy and supplier engagement become part of the product decarbonisation plan.
Where companies go wrong
Across Indian industrial portfolios, the recurring mistakes are predictable.
- Treating PCF as a one-time report instead of a management system
- Mixing financial-year and calendar-year datasets without reconciliation
- Using one generic grid factor while claiming market-based renewable reductions without supporting contract and settlement evidence
- Allocating common utilities using convenience rather than causality
- Ignoring moisture, yield loss, scrap return and internal recycle effects
- Failing to connect supplier data quality to product-footprint confidence
- Not reconciling product-level results back to entity-level Scope 1 and Scope 2 totals
- Publishing intensity trends without explaining production-mix changes
Another common issue is overconfidence in software before process discipline exists. Digital tools help, but poor meter architecture and weak allocation rules will simply automate weak carbon data.
How lenders, developers and policymakers should read PCF in 2026
For lenders, PCF is useful because it links transition risk to cash flow more directly than corporate emissions intensity alone. A borrower may have acceptable aggregate metrics but still face margin compression if its highest-volume export products remain carbon-intensive relative to peer benchmarks.
For RE developers and energy-service providers, product-level carbon data can sharpen commercial propositions. Instead of selling generic energy savings or renewable substitution, they can target lines where each MWh displaced has the highest commercial value in customer contracts or export compliance.
For policymakers and utilities, rising demand for product-level carbon data suggests a broader need for better energy-data infrastructure. Wider submetering, digital settlement transparency, time-stamped renewable accounting and plant-level data protocols can materially improve industrial MRV quality.
This is also relevant to India’s broader carbon-market and trade architecture. Product carbon footprinting does not replace enterprise inventories, but it strengthens the evidence base for abatement planning, market participation and trade competitiveness. Over time, firms with disciplined product-level MRV will be better placed to respond to CCTS evolution, customer disclosure requirements and cross-border carbon scrutiny.
The board-level question: what should companies do in the next 12 months?
A practical board agenda for 2026-27 would be:
- Identify 5-10 products that drive export revenue, customer concentration or carbon exposure
- Build process-route maps and utility assignment for those products first
- Close high-impact metering gaps at utility and line level
- Standardise allocation rules and governance
- Obtain supplier-specific data for the top embedded-emission inputs
- Reconcile PCF outputs with entity emissions and financial production data
- Prioritise abatement for carbon-exposed product lines, not only plant averages
- Refresh the model quarterly and use it in capex screening
This is where RE-led decarbonisation and Carbon markets & MRV increasingly connect. Product-level carbon data tells management where to cut. Market and policy strategy determine how to finance, verify and monetise those cuts.
For Indian industry, the firms that move early will not necessarily be those with the lowest current emissions. They will be those with the cleanest, most defensible product-carbon data and the fastest ability to convert that data into procurement, operations and capex action.
If your organisation needs a plant-to-product carbon strategy, customer-ready methodology, or an abatement roadmap linked to export competitiveness, contact Growthifye’s advisory desk.
Explore Growthifye's related capabilities
This analysis connects directly to our advisory practice: Carbon accounting & disclosure · Net-zero roadmaps & MACC · RE-led decarbonisation · Industrial efficiency & electrification.
About the author

Chief Executive Officer, Growthifye — With over 23 years in management consulting, Sudarshan has taken businesses from concept to scale — building and scaling new-age digital and energy businesses.
- 23+ years in management consulting
- EY alumnus
- Led large-scale BESS programmes, capital raises and advisory mandates
Want this analysis applied to your project?
Talk to our team