Grid Curtailment Risk for RE Projects in India 2026: Forecasting, Contracts, Mitigation
By Sudarshan Karweer · sudarshan@growthifye.com · +91 84510 99371 (Call / WhatsApp) · 2026-08-28
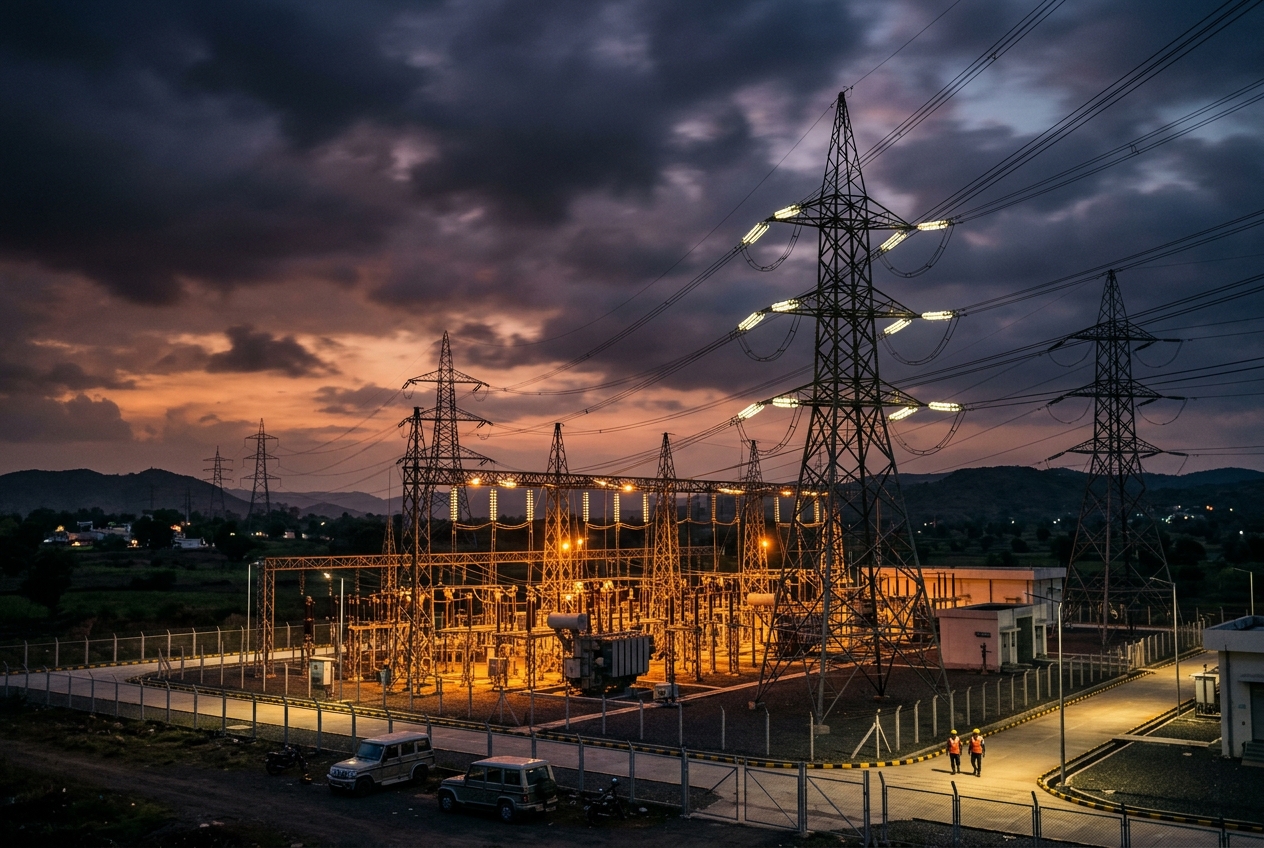
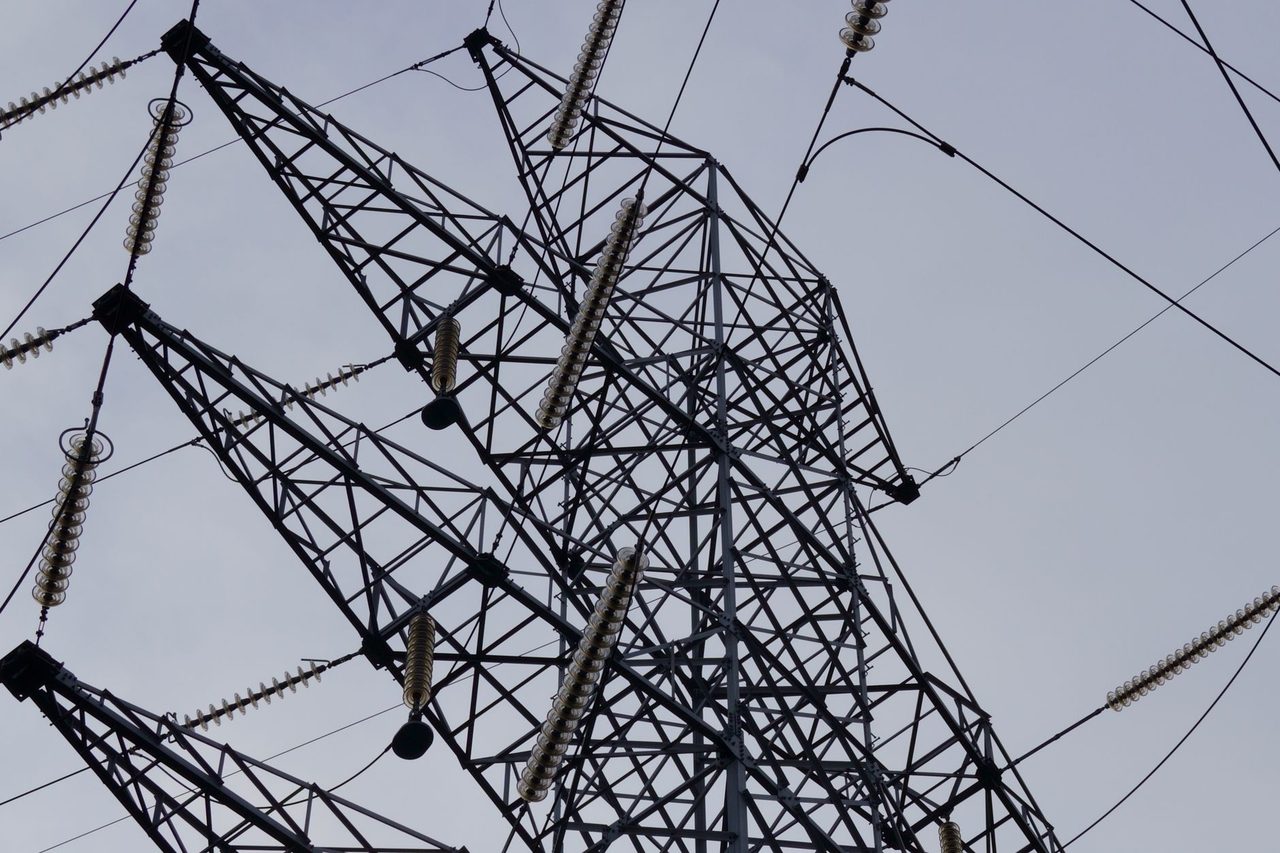
India’s renewable-energy market in 2026 is no longer constrained mainly by module prices, wind turbine delivery or PPA appetite. For many utility-scale and open-access projects, the bigger commercial question is simple: will generated power actually flow when the plant is available?
That is the curtailment question, and it has moved from a generic operational concern to a core diligence item for developers, lenders, C&I buyers, discoms, transmission planners and policymakers. In several RE-rich corridors, project viability now depends not just on tariff and CUF, but on the quality of evacuation planning, grid-code compliance, scheduling discipline, congestion exposure, forecasting maturity and contractual pass-through.
For Indian stakeholders, curtailment is especially important because the market structure is fragmented. Central bids, state bids, merchant and exchange-linked portfolios, group captive plants, third-party open access projects and hybrid RTC structures all face different dispatch realities. Add ISTS charging transitions, state-level banking restrictions, substation readiness issues, seasonal congestion and dynamic security constraints, and the result is a risk that must be quantified early, not explained away after commissioning.
This article focuses on curtailment risk as a standalone transmission and grid-integration topic for 2026, with a practical lens on where losses arise, how they should be modelled, what contracts need to say, and what mitigation actions actually work.
What curtailment means in India in 2026
Curtailment is the forced reduction of generation despite the plant being technically capable of producing electricity. In practice, that reduction can arise from multiple causes, and the commercial treatment may differ in each case.
In Indian RE projects, curtailment usually appears in one or more of the following forms:
- Transmission congestion on interstate or intrastate corridors
- Substation or bay non-readiness during early operation
- System security instructions from SLDC, RLDC or NLDC
- Voltage or reactive power non-compliance at the point of interconnection
- Protection miscoordination or instability concerns during high RE injection periods
- Backdown by state utilities due to demand mismatch, local network constraints or balancing limitations
- Restrictions linked to outage planning, maintenance shutdowns or delayed upstream works
- Open-access scheduling limitations or temporary denial of short-term corridor availability
For financial modelling, treating all curtailment as a single percentage loss is a mistake. Lenders increasingly ask whether the loss is:
- Temporary and construction-linked
- Seasonal and corridor-specific
- Market-linked and recurring during solar peak hours
- Project-specific due to design or compliance weaknesses
- Compensable under PPA/open-access arrangements, or entirely at seller risk
That distinction matters. A 2% annual generation loss due to planned outage windows is very different from 8% curtailment concentrated in high-irradiance months with no contractual compensation.
Why curtailment risk is rising despite transmission build-out
India continues to expand ISTS, intrastate networks and renewable evacuation infrastructure. Yet curtailment risk remains material because generation is scaling faster than local network flexibility in several pockets.
Three structural factors explain the problem in 2026.
First, renewable capacity is clustering geographically. High-quality solar parks and wind corridors in Rajasthan, Gujarat, Karnataka, Tamil Nadu, Andhra Pradesh and Maharashtra continue to attract capacity additions because land, irradiance, wind regime and ecosystem maturity are stronger there than in many alternative locations. This creates local overconcentration even when national renewable targets look well diversified.
Second, the timing of injections is narrow. Solar-heavy portfolios export strongly during limited daytime windows. If upstream lines, pooling substations, STATCOM support, transformation capacity or downstream demand absorption are not aligned, congestion appears quickly. In wind-heavy systems, monsoon-season coincidence can create another kind of stress.
Third, not all evacuation readiness is equal at COD. A project may achieve mechanical completion and basic synchronization while upstream transmission elements, bus reactors, protection schemes, remedial action arrangements or communication integration are still being phased in. On paper, connectivity exists. In reality, dispatch may remain constrained.
This is why lenders are no longer satisfied with generic statements that “the line is under implementation” or “the bay is expected by commissioning.” They want corridor-level evidence, outage assumptions, substation completion status, load-flow margins and realistic backdown scenarios.
The main curtailment drivers developers should quantify before bid or land acquisition
For a serious pre-bid or pre-investment case, curtailment risk should be mapped at four levels: site, evacuation node, regional corridor and offtake contract.
At the site and interconnection level, assess:
- Distance to pooling substation and final delivery point
- Available transformation capacity in MVA versus planned injection in MWac
- Bus configuration and future bay expansion constraints
- Voltage-control requirements and expected reactive range
- Reliability of auxiliary supply and black-start restoration arrangements where relevant
At the evacuation-node level, assess:
- Existing and planned lines from the pooling station
- Loading patterns by season and time block
- Historical outages or commissioning slippages on upstream assets
- Presence of multiple generators depending on the same corridor
- Dependency on yet-to-be-awarded transmission packages
At the regional-system level, assess:
- Peak renewable concentration in the state or sub-region
- Known congestion pockets reported by system operators or market participants
- Coincidence with high solar-hour transmission stress
- Sensitivity to N-1 and dynamic security limits
- State balancing capability and flexibility resources such as hydro, gas, BESS or demand response
At the contract level, assess:
- Whether the PPA defines deemed generation or compensation for backdown
- Whether open-access consumers bear scheduling and curtailment risk entirely
- Monthly versus annual energy settlement basis
- Curtailment treatment during force majeure, system emergencies and transmission outages
- Whether must-run protection is meaningful in actual dispatch practice
Many projects still underestimate the commercial effect of concentrated curtailment. For example, a solar plant with expected first-year generation of 215 million units may appear resilient to a 3% annual loss. But if most of that loss occurs in high-price day blocks under a merchant or exchange-linked strategy, revenue impact can exceed the simple energy-loss percentage. If tariff realization during those blocks is Rs 3.8-4.5/kWh, a 6.5 million unit loss can translate into Rs 2.5-2.9 crore of annual gross revenue impact. For heavily leveraged projects, that is not trivial.
How lenders and investors are underwriting curtailment in 2026
The financing market in 2026 has become more granular on transmission and dispatch risk, especially for standalone open-access, merchant-exposed and hybrid portfolios.
Typical lender questions now include:
- Is the project connected to an operational evacuation system or one under development?
- What percentage of evacuation infrastructure is outside the sponsor’s control?
- What is the downside generation case after curtailment and auxiliary consumption?
- Is there state-specific evidence of persistent RE backdown?
- What contractual remedy exists if evacuation is unavailable post-COD?
- Does the financial model use a flat curtailment assumption without time-of-day revenue sensitivity?
For conservative debt sizing, some lenders now test two cases instead of one:
- Base case: 0.5% to 2% technical and operational curtailment for well-located ISTS-linked projects with strong evacuation readiness
- Downside case: 3% to 8% curtailment for intrastate open-access or corridor-constrained assets, especially in oversupplied zones
For stressed nodes or weakly contracted merchant portfolios, downside assumptions may go beyond 8% during initial years until network augmentation is completed. Debt service reserve expectations also tighten when compensation mechanisms are weak.
This does not mean financing becomes unavailable. It means evidence matters. Projects supported by credible Power system studies, documented transmission milestones, operator correspondence, scenario modelling and contractual fallback options are being differentiated more clearly from speculative land-bank pipelines.
Contract structures: where curtailment pain shows up commercially
The legal and commercial location of curtailment risk varies sharply across Indian project structures.
For central-agency or utility PPAs, developers often assume that must-run status is enough protection. In practice, the issue is more nuanced. Curtailment for grid security reasons may not always trigger clean compensation. Delay or ambiguity in certification can also affect claims.
For C&I open-access projects, risk often sits more directly with the generator and buyer unless the energy supply agreement explicitly allocates:
- Grid unavailability events
- Scheduling failure consequences
- Backdown compensation methodology
- Delivery shortfall treatment
- Substitute power pricing and change-in-law interactions
This matters because C&I customers increasingly plan around delivered energy, not installed capacity. If a 50 MWac solar or hybrid asset serving an industrial load center is routinely curtailed during afternoon production peaks, the buyer’s blended energy cost can deteriorate due to higher drawal from discom supply, exchange purchases or diesel/gas standby arrangements.
In practical drafting, parties should define at least three buckets:
- Seller-controllable losses: forecasting deviation, plant-side outage, inverter restrictions, internal line faults
- Network-side non-availability: bay outage, transmission line outage, system-operator backdown, corridor congestion
- Force majeure and emergency security events
Without this taxonomy, disputes emerge quickly after COD.
The mitigation toolkit: what actually reduces curtailment risk
Curtailment cannot be eliminated fully, but it can be reduced materially with better planning and design choices.
The first lever is location discipline. The cheapest land or fastest state approval is not always the best answer if evacuation margins are structurally weak. A project with slightly lower solar yield but stronger corridor headroom may produce a superior long-term IRR.
The second lever is realistic interconnection design. Oversimplified assumptions around power factor, fault levels, transformer loading and dynamic voltage performance can trigger avoidable dispatch restrictions later. This is where Power system studies and Protection, control & SCADA readiness become commercially important rather than merely procedural.
The third lever is storage and hybridisation. In 2026, co-located BESS economics are still case-specific, but in congestion-prone nodes they can help reshape injection, reduce clipping-plus-curtailment interaction and improve delivery during high-value evening blocks. Even a 0.5-hour to 1.0-hour BESS does not “solve” corridor deficiency, but it can reduce exposure to recurring daytime backdown if dispatch rights and charging rules are structured properly.
The fourth lever is portfolio diversification. Developers with all capacity concentrated in one transmission pocket face correlated curtailment risk. Spreading assets across states, voltage levels, nodal substations and offtake structures can improve cash-flow stability.
The fifth lever is implementation sequencing. Many avoidable losses arise because project COD is pursued ahead of complete evacuation readiness. Better alignment between plant commissioning, bay readiness, telecom integration, protection testing and upstream line energisation reduces the expensive period of “available but constrained” operation. Firms with capabilities in Transmission line engineering and Construction & commissioning support can create practical value here by tightening interfaces across packages.
A practical 2026 diligence checklist for developers, buyers and lenders
Before bid submission, acquisition, financial close or long-term offtake signing, stakeholders should insist on a curtailment-focused diligence note covering the following:
- Node-wise evacuation single-line diagram and status of all linked assets
- Connectivity approval conditions and any staged commissioning dependencies
- Seasonal load-flow assessment for expected injection profile
- N-1 and, where relevant, dynamic security observations affecting dispatch margins
- Historical or market-reported congestion pattern in the area
- Reactive power and voltage-compliance obligations at interconnection point
- SCADA, telemetry, forecasting and scheduling readiness plan
- Contractual treatment of backdown and deemed generation
- Revenue sensitivity by time block, not only annual energy percentage
- Base-case and downside-case DSCR under curtailment scenarios
For C&I consumers evaluating long-term renewable supply, one more question is essential: is your quoted landed tariff lower because the developer has priced in aggressive energy assumptions that ignore deliverability constraints? A tariff that appears cheaper by 15-20 paise/kWh may prove costlier if delivered energy is unstable and balancing purchases increase.
For policymakers and utilities, the lesson is equally clear. Renewable capacity addition targets must be paired with transparent congestion data, faster augmentation execution, better visibility of substation readiness, stronger forecasting integration and more disciplined outage coordination. Curtailment that is opaque becomes litigation. Curtailment that is measurable becomes manageable.
In 2026, the strongest renewable projects in India are not just those with low EPC costs or attractive tariffs. They are the ones built around deliverable power. Curtailment risk should therefore sit at the center of transmission diligence, offtake structuring and financing decisions—not in a footnote to the energy model.
If you are evaluating a new RE site, open-access portfolio, hybrid project or acquisition with evacuation uncertainty, contact Growthifye’s advisory desk. We help developers, investors, C&I buyers and utilities assess grid deliverability, contract risk and mitigation options before those issues hit schedule or IRR.
Explore Growthifye's related capabilities
This analysis connects directly to our advisory practice: Power system studies · HV/EHV substation design · Transmission line engineering · Protection, control & SCADA.
About the author

Chief Executive Officer, Growthifye — With over 23 years in management consulting, Sudarshan has taken businesses from concept to scale — building and scaling new-age digital and energy businesses.
- 23+ years in management consulting
- EY alumnus
- Led large-scale BESS programmes, capital raises and advisory mandates
Want this analysis applied to your project?
Talk to our team