Green Hydrogen in India 2026: RE Sizing, Banking Rules and Delivered H2 Cost
By Sudarshan Karweer · sudarshan@growthifye.com · +91 84510 99371 (Call / WhatsApp) · 2026-09-09
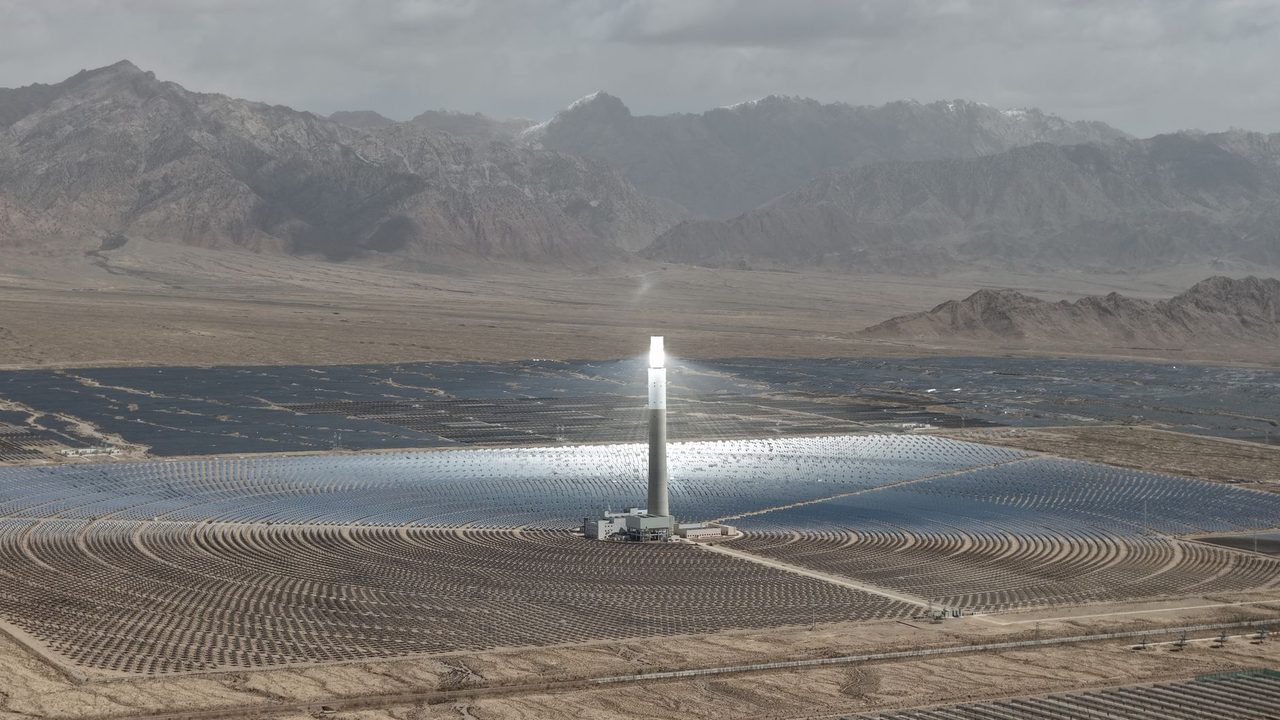
India’s green hydrogen discussion has moved beyond announcements and MoUs. In 2026, serious projects are being screened on one hard metric: delivered hydrogen cost at the plant gate or consumption point, with realistic assumptions on renewable supply, banking, transmission charges, electrolyser loading, water, storage and offtake profile.
For Indian developers, C&I consumers, lenders and policymakers, the central question is no longer whether green hydrogen has long-term strategic value. It is whether a given project structure can produce bankable hydrogen volumes at a cost that industrial buyers will actually sign for. The answer usually depends less on headline electrolyser capex and more on power-system design.
This article focuses on a topic distinct from co-located BESS, FDRE and ancillary-services discussions: how to size renewable energy and structure grid supply for green hydrogen projects in India in 2026, and how those choices drive delivered H2 cost.
Why green hydrogen economics in India are really power-system economics
In most Indian green hydrogen projects, electricity remains the dominant operating cost. Even when electrolyser prices soften, project economics can fail if the renewable configuration forces low plant utilisation or expensive imported grid power during shortfalls.
For a typical PEM or alkaline project, electricity can contribute roughly 55% to 75% of levelised hydrogen cost, depending on utilisation, renewable sourcing model and wheeling/open-access framework. That is why hydrogen projects must be evaluated as integrated energy systems rather than as standalone process plants.
The practical design variables are straightforward:
- Electrolyser capacity in MW
- Annual operating hours and target utilisation factor
- Renewable mix: solar, wind, hybrid, hydro-backed or grid-following
- Location relative to load, substation and water source
- Open-access route and state-level banking provisions
- Short-term balancing through grid drawal, battery storage or overbuilding RE
- Hydrogen storage duration and offtake flexibility
A 100 MW electrolyser running at 35% utilisation and a 100 MW electrolyser running at 70% utilisation are not remotely similar projects from a lender’s viewpoint, even if the capex per MW looks comparable. The second project spreads fixed cost over nearly double the hydrogen output. In practice, one of the most common modelling errors is underestimating the cost of achieving higher electrolyser load factors.
The 2026 Indian policy context that actually matters for project viability
By 2026, the National Green Hydrogen Mission continues to provide strategic direction, but project viability still turns on implementation details across power, transmission and state regulations.
Developers should pay particular attention to the following policy and commercial levers:
- ISTS charge waivers and their applicability windows for eligible renewable supply arrangements
- State open-access charges, including wheeling, cross-subsidy surcharge and additional surcharge where applicable
- Banking rules by state and by DISCOM, including banking charge, settlement period and restrictions on drawal timing
- Curtailment risk and scheduling obligations for interstate and intrastate supply
- Water extraction permissions and industrial water tariff
- Land conversion and evacuation timelines
- Certification and traceability requirements for green hydrogen claims, especially for export-oriented projects
Many boardroom models still assume generic “open access power at Rs 3 to Rs 3.5 per kWh.” That is not enough. In 2026, the spread between a well-structured RE supply arrangement and a poorly chosen one can easily move delivered hydrogen cost by Rs 20 to Rs 60 per kg, depending on utilisation and state regime.
For export-linked projects, hourly matching expectations and carbon-intensity accounting are also becoming more material. A project designed only around annual energy balance may struggle if buyers demand tighter temporal correlation between renewable generation and electrolysis.
Renewable sizing for electrolysers: the core trade-off
The first major design choice is whether to optimise for low-cost energy or high electrolyser utilisation. You rarely get both without careful hybridisation.
A solar-only configuration can produce very low daytime energy cost in high-irradiance states, but it usually leads to poor electrolyser utilisation unless the plant accepts low annual operating hours or supplements with grid power. Wind improves temporal spread and monsoon-season generation, but wind resource quality, land aggregation and evacuation complexity differ widely by state. Hybrid portfolios usually perform better than single-resource systems, but they may increase development complexity.
At a simplified level, hydrogen output can be approximated from specific electricity consumption. If an electrolyser consumes around 50 to 55 kWh per kg of hydrogen including balance-of-plant effects, then:
- 1 MW running continuously for 24 hours consumes 24 MWh per day
- At 52 kWh/kg, that yields about 462 kg/day
- At 70% annual utilisation, 1 MW can produce roughly 118 to 120 tonnes per year
- At 40% utilisation, output drops to roughly 67 to 69 tonnes per year
That utilisation gap is decisive.
Consider a stylised 100 MW electrolyser:
- At 40% utilisation, annual electricity use is about 350 GWh
- At 70% utilisation, annual electricity use is about 613 GWh
- At 52 kWh/kg, annual hydrogen output rises from about 6,730 tonnes to about 11,790 tonnes
If electrolyser and balance-of-plant capex are fixed, the higher-utilisation plant sharply reduces per-kg fixed cost recovery. But achieving 70% utilisation may require substantially more renewable capacity, better hybrid shaping, some storage or limited grid top-up. The right answer depends on tariff, charges and offtake value.
In Indian conditions, three broad renewable configurations are most common:
- Solar-heavy: lower energy cost, lower utilisation unless grid-backed
- Wind-solar hybrid: better annual load shaping, more complex siting and evacuation
- Hybrid plus firming: improved utilisation through storage or controlled grid drawal, but higher all-in power cost
The optimisation target should be delivered hydrogen cost, not lowest nominal RE tariff.
Banking, grid drawal and open-access charges can make or break the model
For hydrogen plants using off-site renewable supply, banking is often more valuable than developers initially realise. If midday solar injection can be banked efficiently and redrawn for evening or early-morning electrolyser operation, utilisation improves without full dependence on battery storage. But the usefulness of banking depends on the state framework.
The commercial impact comes from five questions:
- Is banking permitted for the consumer category and contract structure?
- Is banking settled monthly, annually or on a more restrictive basis?
- What banking charge applies per unit?
- Are there peak-hour restrictions on redelivery?
- What happens to unutilised banked energy at settlement?
A project that assumes liberal banking in a restrictive state can show a false improvement in hydrogen cost. Equally, a project that ignores viable banking may overinvest in renewable overbuild or storage.
Grid drawal economics must also be treated carefully. Developers often include occasional grid power to keep the electrolyser loaded during low-RE hours. That can be sensible, but only if the all-in cost is modelled correctly.
The relevant cost stack may include:
- Energy charge
- Transmission and wheeling charge
- Cross-subsidy surcharge
- Additional surcharge
- Losses
- Demand charges where applicable
- Deviation and scheduling costs for larger arrangements
Even if occasional grid drawal forms a modest share of annual energy, it can materially affect average power cost and carbon accounting. For some industrial hydrogen applications, a partially grid-backed configuration may still be commercially acceptable. For export or strict green procurement claims, it may not.
A practical 2026 cost framework for delivered green hydrogen
In current Indian market discussions, delivered green hydrogen cost for early projects can still vary widely depending on scale, location and utilisation. Rather than quoting a single number, it is better to build from components.
A practical levelised cost framework includes:
- Renewable power supply cost, net of losses and charges
- Electrolyser capex and stack replacement profile
- Water treatment and demineralisation
- Compression, storage and loading system
- O&M for electrolyser and renewable assets
- Land, evacuation and substation infrastructure
- Financing cost, DSCR expectations and construction period assumptions
- Curtailment and degradation allowances
- Logistics cost if hydrogen is moved off-site
As an indicative range for 2026 screening, well-structured Indian projects may target plant-gate hydrogen cost around Rs 240 to Rs 360 per kg in stronger cases, while weaker-utilisation projects or projects with costly delivered power can be materially above that range. Export-oriented derivatives such as ammonia add further conversion and handling cost, but may create better revenue certainty depending on offtake structure.
What shifts the result most?
- Electrolyser utilisation factor
- Effective delivered electricity cost in Rs/kWh
- Stack replacement timing and cost
- Financing assumptions
- Capacity factor of the renewable portfolio after curtailment and losses
A useful rule of thumb is that a change of Re 1/kWh in effective electricity cost can significantly move hydrogen cost, especially at scale. Likewise, moving electrolyser utilisation from the low-40s to the mid-60s can transform project economics if achieved without excessively raising average power cost.
Site selection is not just about cheap land or high solar irradiation
Many Indian hydrogen proposals still start with land-first thinking. That is risky. Good hydrogen siting is multi-variable and should combine energy, water, evacuation and offtake constraints.
A robust site-screening exercise should assess:
- Solar and wind resource complementarity within feasible evacuation radius
- Access to high-capacity substations and realistic bay availability
- Water source reliability, treatment needs and seasonal constraints
- Distance to refinery, fertiliser, steel, chemical or export infrastructure
- State open-access and banking regime
- Land topology and permitting risk
- Construction logistics for heavy equipment
- Future expansion options for downstream derivatives
For example, a state with excellent solar irradiation but restrictive banking and high OA cost may be inferior to a hybrid-resource state with more flexible energy settlement. Similarly, a port-proximate site may look attractive for ammonia exports but underperform if RE evacuation is weak or water sourcing is contested.
This is where disciplined feasibility work matters. Developers that run hourly energy modelling, charge mapping and offtake-linked dispatch logic early tend to avoid expensive redesign later. Lenders increasingly expect that level of rigour.
What lenders and industrial offtakers will scrutinise in 2026
From a financing and contracting perspective, green hydrogen in India is moving into a more demanding phase. Generic presentations on mission-scale opportunity are no longer enough. Credit committees and industrial buyers want dispatch realism.
Expect the following questions:
- What is the hourly or sub-hourly renewable generation basis for the model?
- How is electrolyser loading managed during low-resource periods?
- What curtailment assumption has been used, and why?
- Which charges are fixed by regulation and which are exposed to change?
- Is hydrogen offtake flat, seasonal or interruptible?
- How much storage is included, in hours or days of output?
- What is the stack degradation and replacement strategy?
- How sensitive is DSCR to power-cost escalation or lower utilisation?
- Is there a credible backup supply strategy if one renewable source underperforms?
For industrial users such as refineries, fertiliser producers, steelmakers and chemical companies, project design must also align with process reality. Few large consumers need a purely theoretical annual quantity. They need dependable daily or weekly availability, pressure specifications, purity assurance and workable outage planning.
This means hydrogen projects should be structured around offtake behaviour, not just generation potential. In many cases, the winning configuration will not be the lowest-LCOE renewable setup. It will be the one that best matches contracted hydrogen delivery obligations with manageable risk.
The strategic takeaway for Indian developers and C&I buyers
India’s green hydrogen opportunity remains real, but project economics in 2026 are highly sensitive to upstream power architecture. The cheapest announced renewable tariff does not automatically produce the cheapest hydrogen. In many cases, a slightly higher average RE cost with better temporal matching can deliver a lower final Rs/kg number because electrolyser utilisation improves and fixed costs are spread over more output.
That is why serious project development now requires integrated modelling across renewable sizing, open-access charges, banking, grid integration, storage strategy, offtake profile and financing assumptions. The projects that clear investment committees will be those that treat hydrogen as a system-design problem, not a single-equipment procurement exercise.
For Indian developers, utilities, industrial consumers and policymakers, the next wave of successful projects will likely share five traits:
- Realistic hourly energy modelling
- State-specific charge and banking analysis
- Sensible hybrid RE design rather than one-resource simplification
- Clear offtake-linked operating philosophy
- Bankable downside-case economics
If you are evaluating a green hydrogen project, a renewable supply strategy or delivered H2 cost competitiveness in India, contact Growthifye’s advisory desk for project-specific modelling, feasibility support and lender-grade commercial analysis.
About the author

Chief Executive Officer, Growthifye — With over 23 years in management consulting, Sudarshan has taken businesses from concept to scale — building and scaling new-age digital and energy businesses.
- 23+ years in management consulting
- EY alumnus
- Led large-scale BESS programmes, capital raises and advisory mandates
Want this analysis applied to your project?
Talk to our team