Energy Portfolio Management Software in India 2026: Forecasting, Scheduling and ROI
By Sudarshan Karweer · sudarshan@growthifye.com · +91 84510 99371 (Call / WhatsApp) · 2026-08-28

India’s renewable-power market is no longer managed plant by plant. In 2026, value is increasingly won or lost at the portfolio level: day-ahead and real-time market positions, forecast accuracy, open-access schedules, imbalance charges, banking rules, settlement reconciliation, and margin visibility across multiple states and counterparties. That is why energy portfolio management software is emerging as a distinct priority for Indian generators, C&I consumers, traders, utilities and lenders.
For many firms, this is the missing layer between plant systems such as SCADA or EMS and enterprise systems such as ERP. It is where commercial decisions are operationalised every 15 minutes: what to schedule, where to inject, when to buy from exchange, how to optimise captive and group-captive consumption, how to reconcile deviation and transmission charges, and how to report risk to management and financiers.
This article explains what energy portfolio management software means in the Indian context in 2026, who needs it, what capabilities matter, what the implementation roadmap looks like, and where the measurable ROI comes from.
Why portfolio-level software matters in India in 2026
Three structural shifts are driving adoption.
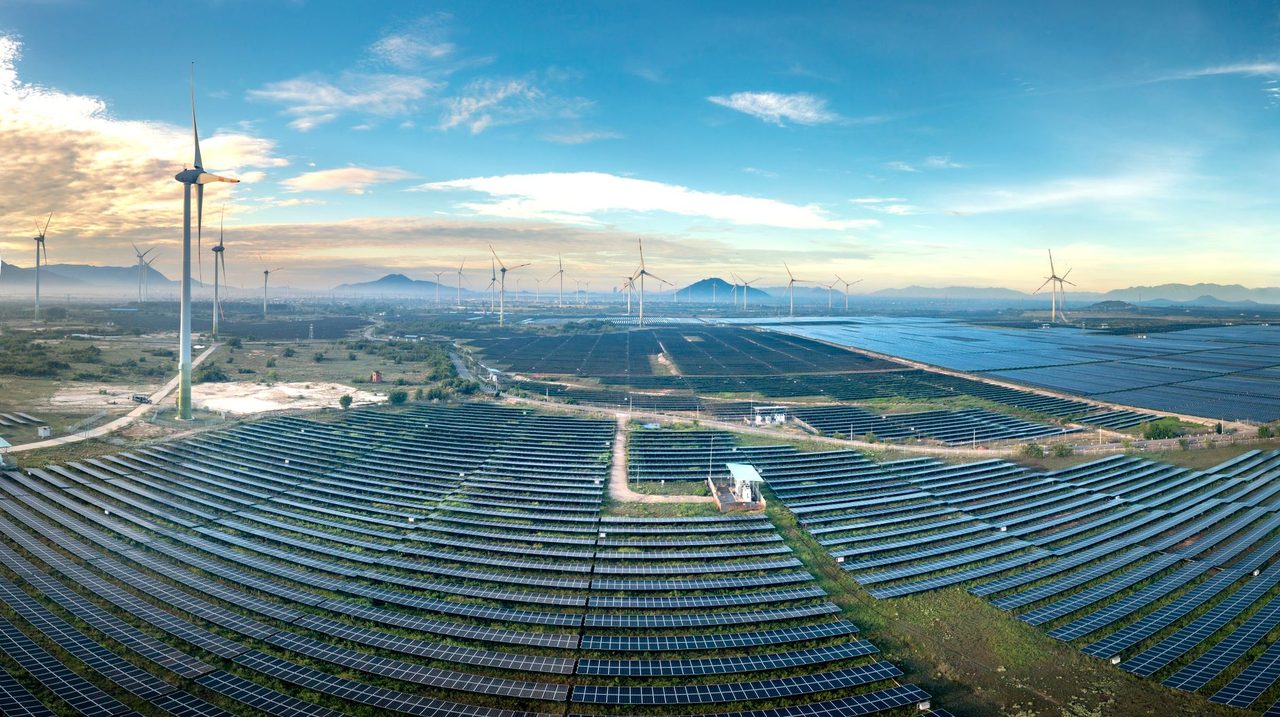
First, renewable portfolios are larger and more geographically dispersed. Developers now routinely operate combinations of utility-scale solar, wind, wind-solar hybrid, storage-linked projects and C&I open-access assets spread across multiple states. That increases exposure to differing state regulations, SLDC processes, wheeling and banking rules, and commercial settlement complexity.
Second, power-market participation is deepening. The day-ahead market, real-time market, green day-ahead products, bilateral scheduling, ancillary participation for selected assets, and merchant exposure all require tighter forecast-to-schedule workflows. A 100 MW portfolio with even modest merchant exposure can see significant monthly P&L swings if forecast, bidding and reconciliation are still spreadsheet-driven.
Third, C&I procurement strategies are becoming more dynamic. Large industrial consumers are blending rooftop solar, captive or group-captive procurement, exchange purchases, DISCOM supply, and in some cases storage or demand flexibility. Their challenge is not just buying renewable power; it is minimising landed energy cost while maintaining compliance and reliability.
In practical terms, the old operating model breaks under 2026 conditions. If a developer is managing 500 MW across five states with separate scheduling entities, multiple offtakers and mixed tariff structures, email plus spreadsheets create delays, version confusion and revenue leakage. The same applies to a steel, cement, chemicals or data-centre operator managing multi-site open-access and captive energy flows.
What energy portfolio management software includes
In India, energy portfolio management software is not one monolithic application. It is usually a set of integrated capabilities deployed on a shared data model.
Core functions typically include:
- Generation and load forecasting at plant, pooling-station, state and portfolio level
- Schedule preparation for SLDC/RLDC submissions and internal approvals
- Market bidding support for DAM, RTM and bilateral decisions where relevant
- Open-access nomination and consumption planning for C&I users
- Contract management for PPAs, captive arrangements, banking conditions and exchange positions
- Tariff, charge and settlement engines covering energy, deviation, transmission, wheeling, losses and surcharges
- Position dashboards showing scheduled, actual, contracted and exposure volumes
- Margin and P&L analytics by asset, offtaker, state and market product
- Alerts for forecast error, schedule mismatch, curtailment, payment delay and compliance deadlines
- Lender and management reporting
This sits alongside adjacent systems.
- SCADA and historians provide operational data.
- Weather and satellite sources support forecasting.
- ERP handles accounting, invoicing and vendor workflows.
- EAM tracks asset maintenance.
- Exchange, SLDC and metering interfaces provide commercial and regulatory transaction data.
The business value comes from connecting these layers in near real time. This is why many successful programs are built as part of broader IT strategy & roadmaps rather than as stand-alone software purchases.
High-value use cases by stakeholder
Renewable developers and IPPs
For developers, the immediate use case is tighter forecast-to-settlement control.
A 250 MW wind-solar portfolio may have day-ahead schedules, intra-day revisions, curtailment events, pooling-station losses, state-specific deviation rules and several offtake structures. Without a portfolio layer, teams often discover commercial variance only after weekly or monthly settlement. With software, they can track expected versus actual revenue daily and identify whether loss is caused by forecast error, evacuation constraints, curtailment, poor schedule revision discipline, or invoice mismatch.
Typical benefits include:
- 10-30% reduction in internal effort for scheduling and reconciliation teams
- 0.5-1.5 percentage point improvement in net realised revenue for portfolios with merchant or flexible offtake exposure
- Faster monthly closure and audit readiness
- Better lender reporting for DSCR monitoring and covenant visibility
For a 500 MW portfolio with blended annual generation of roughly 1.2-1.5 billion kWh, even a Rs 0.03-0.08 per kWh improvement in realised value translates to around Rs 3.6 crore to Rs 12 crore per year.
C&I consumers using open access or captive power
For Indian industrial buyers, the issue is landed cost optimisation, not only renewable percentage.
A multi-site manufacturer may be paying DISCOM tariffs of Rs 7-10 per kWh in one state, while accessing open-access renewable power at an effective landed cost of Rs 4.2-6.5 per kWh depending on banking, cross-subsidy surcharge, additional surcharge, losses and time-of-day dynamics. The gap looks attractive on paper but can erode quickly if schedules are poorly aligned to plant consumption or if banking assumptions prove wrong.
Portfolio software helps by combining:
- Site-wise demand forecasts
- Open-access availability forecasts
- Contracted renewable entitlements
- Exchange price signals
- Banking balances and expiry logic
- Demand-charge and time-of-day implications
This enables procurement teams to answer a practical daily question: should the next unit be met through captive renewable, exchange purchase or DISCOM drawal?
For a C&I buyer consuming 200 million kWh annually, a 2-4% reduction in total power procurement cost through improved scheduling, lower imbalance and smarter source selection can be worth Rs 1.5 crore to Rs 6 crore per year depending on the starting tariff and open-access structure.
Utilities and distribution companies
Utilities increasingly need portfolio visibility too, especially where renewable procurement obligations, power-purchase optimisation and short-term market balancing interact.
An EPM layer can support:
- Renewable injection visibility versus contracted demand
- Purchase optimisation between long-term contracts and spot markets
- Renewable forecast integration for balancing procurement
- Settlement analytics
- Better preparation for state and central compliance reporting
While utility transformation cycles are longer, the commercial value is real in reducing over-procurement, under-scheduling and balancing cost.
Lenders and investors
Lenders are not software end-users in the operational sense, but they benefit from standardised portfolio data. In 2026, financing teams are asking tougher questions on curtailment risk, merchant share, payment delays, scheduling discipline, and monthly variance between modelled and realised cash flow.
A borrower with a robust digital portfolio layer can provide cleaner evidence on:
- Net generation and net injection
- Counterparty payment ageing
- State-wise charge leakage
- Forecast error trends
- Contracted versus merchant exposure
- Asset-level and portfolio-level DSCR sensitivity
That can shorten diligence cycles and improve confidence in post-disbursement monitoring.
The Indian IT stack for portfolio management
The architecture should be modular, API-first and cloud-friendly, but grounded in Indian workflow reality.
A typical 2026 stack includes:
- Data ingestion from SCADA, meters, weather providers, exchanges, SLDC/RLDC files, ERP and contract repositories
- A portfolio data model with asset, schedule, contract, market and settlement entities
- Forecasting models for generation and load, including state- and season-specific tuning
- Workflow engine for schedule preparation, approval and revision
- Rules engine for tariffs, losses, wheeling, banking and deviation logic
- Analytics layer with dashboards, alerts and scenario modelling
- Integration layer into ERP & asset management systems for invoicing, accruals and financial closure
- Identity, audit trail and Cybersecurity controls, especially where operational and market systems intersect
Cloud deployment is increasingly preferred for analytics and workflow scalability, particularly for firms expanding across states. However, some operational data paths may stay hybrid due to latency, security or legacy constraints. In practice, many firms start with a targeted Cloud migration of forecasting, data lake and analytics workloads while retaining selected interfaces on-premise.
Data governance matters more than software brand selection. Common failure points are not algorithmic; they are master-data inconsistency, unclear ownership of schedule versions, poor contract codification and weak settlement rules maintenance.
ROI: where Indian companies actually capture value
The strongest business case is usually a combination of four value pools.
1) Forecast and scheduling improvement
Even if state-specific DSM treatment differs, better forecast discipline reduces avoidable commercial leakage. For portfolios with merchant, open-access or balancing exposure, small gains matter. A 1-2% improvement in schedule accuracy can produce outsized commercial benefit where deviations, balancing purchases or missed market opportunities are significant.
2) Settlement and charge reconciliation
Indian power settlements remain operationally complex. Errors commonly arise in:
- Energy accounting versions
- Transmission loss application
- Wheeling-loss factors
- Banking carry-forward and lapse treatment
- Cross-subsidy and additional surcharge application
- Invoice generation and payment follow-up
Recovering even 0.2-0.6% of annual billed value through better reconciliation can justify the software in larger portfolios.
3) Team productivity and control
A serious portfolio operation may involve scheduling, trading, commercial, finance, regulation and plant teams. Manual coordination consumes time and creates key-person dependency. Workflow automation can reduce cycle times for daily scheduling, month-end settlement and management reporting by 20-40%.
4) Better decisions on contracting and market exposure
Software should not only report yesterday’s outcome. The more strategic ROI comes from comparing scenarios:
- Fixed tariff versus partial merchant
- Banking-heavy structure versus firmer supply profile
- State A versus State B for new C&I offtake
- Exchange procurement versus bilateral short-term cover
- Storage addition versus curtailment loss tolerance
This is where Data & analytics platforms become decision infrastructure rather than reporting tools.
For many Indian firms, payback can fall in the 9-18 month range if the portfolio is above roughly 200 MW on the supply side or above 100 million kWh annual managed demand on the consumption side. Smaller portfolios may still justify implementation if complexity is high across states or counterparties.
Implementation roadmap: what works in practice
A pragmatic rollout is better than a big-bang deployment.
Phase 1: diagnostic and business case
Map the current process from forecast to schedule to settlement to invoice. Quantify where value leaks today.
- Revenue variance from forecast error
- Time spent on scheduling and reconciliation
- Delayed invoices and dispute backlog
- State-wise landed-cost opacity
- Weakness in management and lender reporting
This phase usually defines the target operating model and the minimum viable product.
Phase 2: data foundation and interfaces
Connect SCADA, weather, meter, contract and ERP data. Standardise asset hierarchy, meter naming, schedule IDs, contract metadata and settlement calendars.
Do not underestimate this step. In most Indian deployments, 50% of implementation pain sits in data quality and interface design.
Phase 3: forecasting, workflow and core analytics
Deploy generation and load forecasting, schedule workflows, exception alerts and commercial dashboards. Start with 2-3 high-priority states or business units.
Phase 4: settlement engine and financial integration
Automate reconciliation logic and integrate outputs to finance processes. This is often where hidden ROI becomes visible because disputes, delays and manual adjustments reduce materially.
Phase 5: optimisation and scenario analytics
Once core controls are stable, add market optimisation, what-if analysis and portfolio risk views for management.
Governance is essential. The project should have clear ownership across operations, commercial, finance and IT. That is why Program governance is not a side issue; it is central to whether the platform gets adopted or turns into another reporting tool with low business impact.
What decision-makers should ask before investing
Before selecting a vendor or building in-house components, ask six questions.
- Which commercial decisions do we need to improve every day, not just every month?
- Which state-specific rules and charge structures most affect our portfolio economics?
- Where is value leakage today in paise per kWh or in annual rupees?
- Which systems are already in place, and which integrations are mandatory from day one?
- Who owns settlement-rule maintenance as regulations evolve?
- What management, lender and compliance reports should be generated automatically?
A company that cannot answer these questions will likely overbuy features and underdeliver ROI.
The 2026 outlook
In India, energy portfolio management software is moving from a niche trader tool to a mainstream operating platform for renewable developers, open-access consumers and utilities. As renewable penetration rises and commercial complexity increases, the winners will not simply have more megawatts. They will have better portfolio intelligence, faster commercial workflows, cleaner settlement data and tighter control over margin.
The next phase of digital value in the power sector is not only at the equipment layer or the enterprise layer. It is in the commercial operating layer that links forecasts, markets, contracts and cash flow.
If your organisation is scaling renewable assets, managing multi-state open access, or seeking tighter visibility on revenue and risk in 2026, contact Growthifye’s advisory desk to assess the right portfolio-management architecture, business case and implementation roadmap.
Explore Growthifye's related capabilities
This analysis connects directly to our advisory practice: IT strategy & roadmaps · ERP & asset management systems · Data & analytics platforms · Cloud migration.
About the author

Chief Executive Officer, Growthifye — With over 23 years in management consulting, Sudarshan has taken businesses from concept to scale — building and scaling new-age digital and energy businesses.
- 23+ years in management consulting
- EY alumnus
- Led large-scale BESS programmes, capital raises and advisory mandates
Want this analysis applied to your project?
Talk to our team