Energy Asset Performance Management Software in India 2026: APM, ROI and Rollout
By Sudarshan Karweer · sudarshan@growthifye.com · +91 84510 99371 (Call / WhatsApp) · 2026-09-09

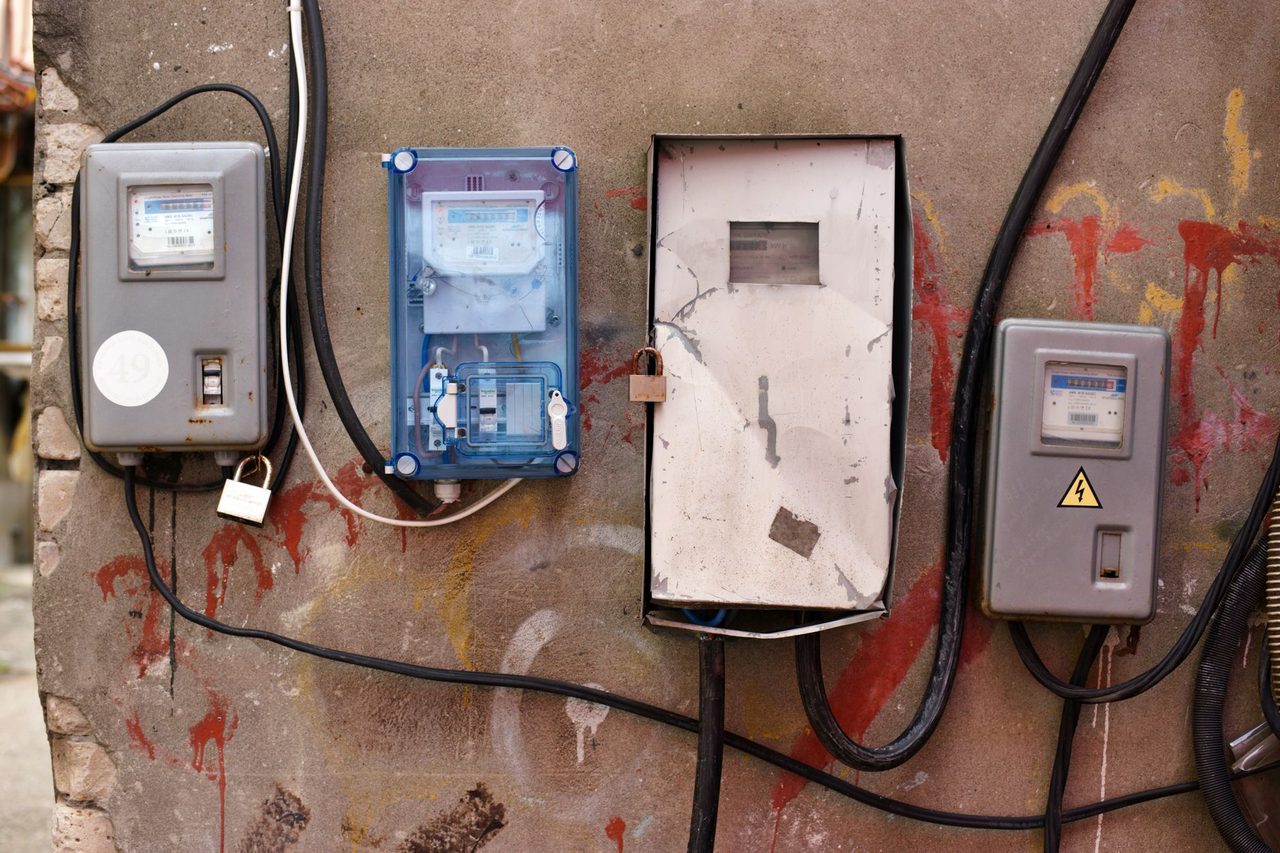
Photo: Gustavo Fring on Pexels
India’s power and renewable-energy sector has spent the last five years digitising core transactions, telemetry and controls. Many generators now run some combination of SCADA, historian, CMMS/EAM, ERP, drone inspection, inverter portals and cloud dashboards. Yet a recurring gap remains between raw operational data and maintenance decisions that actually reduce forced outages, improve plant load factor and protect cash flows. That gap is where energy asset performance management software, or APM, matters.
For Indian C&I energy consumers, independent power producers, renewable developers, utilities, lenders and policymakers, APM is becoming a practical 2026 priority rather than a technology experiment. Module prices have softened over the past few years, but tariffs remain tight, curtailment risk persists in several states, and debt service tolerance for avoidable downtime is low. Whether the asset is a 300 MW solar park in Rajasthan, a 150 MW wind portfolio in Tamil Nadu, a biomass captive plant in Punjab, or a thermal unit supporting utility dispatch, the economics of maintenance quality are now visible line by line.
This article explains what APM means in the Indian power context, where it delivers measurable value, the data and integration architecture required, and how to build an implementation roadmap that lenders and management teams can trust.
Why APM is a distinct software layer in 2026
APM is not just EAM, not just SCADA analytics, and not just a maintenance dashboard. In practice, it is a decision layer that combines asset hierarchy, equipment condition, failure modes, work orders, operating context and risk logic to answer four questions:
- Which critical assets are likely to fail or degrade next?
- What is the financial and operational consequence if they do?
- What maintenance action should be taken, when, and at what cost?
- Which interventions deliver the highest improvement in availability, heat rate, generation yield or life extension?
Indian operators often have the ingredients but not the workflow. SCADA shows alarms and trends. Historian systems store sensor streams. ERP and CMMS track procurement and maintenance execution. OEM portals show asset-specific diagnostics. But unless these systems are connected into a reliability-centric workflow, teams still depend heavily on manual spreadsheet triage and experience-based prioritisation.
That approach breaks down at scale. A 1 GW renewable platform may have millions of daily data points across inverters, trackers, weather stations, combiner boxes, transformers and evacuation equipment. A utility thermal fleet may have hundreds of rotating and balance-of-plant assets where vibration, lubrication, temperature and load cycling patterns matter. APM gives a structured method for converting these signals into ranked risk and prescribed action.
Where APM delivers the strongest value in India
The best APM business cases in India are usually found where three conditions exist: asset criticality is high, downtime is expensive, and condition data is already available or can be captured at low cost.
For utility-scale solar, the strongest use cases include:
- Central inverter health scoring using fault codes, thermal indicators and restart history
- String and combiner anomaly detection to isolate underperformance that routine PR reports miss
- Tracker actuator and control failure prediction in high-dust or high-wind sites
- Main transformer and switchyard condition tracking, where failure has disproportionate revenue impact
- Balance-of-system degradation analysis, especially in older portfolios commissioned between 2017 and 2021
For wind portfolios, high-value APM use cases include:
- Gearbox, generator and pitch-system condition monitoring
- Yaw misalignment detection and performance-loss quantification
- Blade health prioritisation using SCADA, inspections and event history
- Converter fault pattern analysis across turbine models and sites
- Spares optimisation for remote and low-wind-season maintenance windows
For thermal, hydro and industrial captive power, APM often starts with:
- Boiler feed pump and fan reliability
- Turbine auxiliaries and lubrication systems
- Condenser and cooling-system performance deterioration
- Transformer and substation health indexing
- Residual life assessment support for life-extension decisions
For C&I consumers operating captive, group captive or hybrid systems, the value is slightly different. The objective is not only generation maximisation but also continuity of plant operations, reduction in grid-import exposure during peak tariffs, and better planning of maintenance around production schedules. For a large industrial site paying blended power costs of Rs 6.5 to Rs 9 per kWh depending on state, open-access charges and time of day, avoidable loss of captive renewable output can quickly erode the expected savings model.
The India ROI case: what numbers matter
APM projects fail when ROI is framed vaguely as “better visibility.” In India, the investment case has to be tied to generation recovery, outage reduction, O&M productivity and risk reduction.
For utility-scale solar, practical ROI levers often include:
- 0.3% to 1.2% annual generation recovery through faster detection and closure of underperformance issues
- 10% to 25% reduction in mean time to repair for recurring faults when alerts are linked to workflows
- 5% to 15% optimisation in consumables and spares usage through condition-based scheduling
- Lower liquidated damages or contract disputes where availability obligations exist under O&M or supply agreements
At a 100 MW solar plant with a CUF of 24%, annual generation is roughly 210 million units. A 0.7% recovery equals about 1.47 million units. At a realised tariff of Rs 2.9 to Rs 3.4 per kWh, that is approximately Rs 43 lakh to Rs 50 lakh per year before secondary benefits.
For wind, because component failures can cause larger downtime events, the upside can be more pronounced but more variable:
- 1% to 3% reduction in downtime for targeted fleets with chronic gearbox, pitch or converter issues
- 2% to 5% reduction in maintenance cost variance through better planning of crane, crew and spares events
- Better seasonal readiness before monsoon and high-wind periods
At a 250 MW wind portfolio with a 32% PLF, annual generation is about 701 million units. Even a 1% availability-linked gain can be economically meaningful, particularly for assets under merchant, hybrid or open-access structures where delivered value may exceed the nominal PPA tariff.
For thermal and industrial power assets, the economics often come through avoided forced outages, heat-rate stability and better outage planning. A single avoided major auxiliary failure can justify the software and instrumentation cost if replacement lead time is long and production loss is material.
Lenders should look beyond simple software payback. APM can strengthen forecast reliability, reserve adequacy planning, maintenance governance and insurer conversations. In refinancing or acquisition diligence, the presence of a robust asset health and reliability programme may support more confidence in future generation and O&M assumptions, especially for ageing portfolios.
What data and integrations are actually required
An effective APM rollout does not require every data source on day one, but it does require a clean minimum baseline. Most Indian deployments should begin with the following:
- Asset hierarchy aligned across plant, substation, feeder, inverter, turbine, transformer and component levels
- Time-series data from SCADA or historian with reliable tag mapping and time synchronisation
- Event and alarm history with codes normalised across OEM variants where possible
- Maintenance work orders, failure records and parts consumption from CMMS/EAM or ERP
- Inspection data, including thermography, oil analysis, vibration, IV curve tests or borescope reports where relevant
- Production and availability calculations with clear formulas and exception logic
The integration challenge in India is often less about data volume and more about data quality and ownership. EPC contractors, O&M providers, asset owners and OEMs may all hold different pieces. Naming conventions are inconsistent. Work-order closeout data is incomplete. Alarm floods create noise. Site connectivity may be intermittent.
This is why APM programmes should be positioned as operating-model change, not just software installation. In many cases, the fastest route is to define a small critical-equipment scope and build a usable data model around it. For example:
- Solar: inverters, trackers, transformers and weather stations
- Wind: gearbox, pitch, converter and main transformer
- Thermal: top 20 bad actors by outage impact
From a systems perspective, APM usually sits above operational data collection and beside enterprise workflows. It should integrate with ERP & asset management systems, historian platforms and, where relevant, Data & analytics platforms used for fleet reporting. If cloud is part of the target architecture, data residency, latency, OT segmentation and backup procedures need explicit design.
Governance, compliance and cybersecurity considerations
In 2026, no serious energy software programme in India can ignore cybersecurity and regulatory alignment. If APM consumes OT-origin data or influences maintenance action on critical assets, the architecture must respect network segmentation, access controls and logging requirements.
Relevant considerations may include:
- CEA cyber directives and utility-specific operating procedures
- NCIIPC expectations for critical infrastructure entities where applicable
- Read-only data pathways from OT to IT environments wherever feasible
- Identity and role-based access controls for OEMs, O&M contractors and central teams
- Audit trails for recommendation acceptance, override and work-order closure
- Backup and recovery planning for models, rules and historical condition records
For public utilities and state entities, procurement and hosting choices may also need to align with internal policy, CERT-In reporting processes and approved-cloud guidelines. For private developers, lender covenants and cyber-insurance requirements are becoming more relevant, particularly for portfolios with centralised remote operations centres.
This is where structured IT strategy & roadmaps add value. APM cannot be isolated from wider decisions on cloud, integration middleware, master data, cybersecurity and field-mobility processes.
A practical rollout roadmap for Indian developers and utilities
The most successful APM programmes in India tend to follow a staged model rather than a big-bang transformation.
Phase 1: Value discovery and criticality definition
- Identify top assets by revenue impact, outage risk and maintenance spend
- Baseline current KPIs: availability, MTBF, MTTR, forced outage hours, spare turns, generation loss
- Quantify pain points by site, OEM and component family
- Confirm data availability and gaps
Phase 2: Pilot on one fleet or asset class
- Choose a contained scope with visible economic impact
- Build asset hierarchy and failure-mode library
- Connect SCADA/historian and maintenance records
- Configure health indices, rules and escalation workflows
- Run the pilot through one operating cycle, not just a demo period
Phase 3: Workflow integration
- Link alerts to work orders, approvals and spare reservations
- Define who acts on which recommendation and within what SLA
- Measure false positives and refine thresholds
- Introduce management reviews tied to financial outcomes, not just technical metrics
Phase 4: Fleet scale-up
- Extend to additional sites and OEM combinations
- Add advanced models where data quality supports them
- Standardise reliability reporting across portfolio companies or SPVs
- Integrate lessons into annual O&M budgeting and lender reporting
Organisations often underestimate change management. Site teams may distrust central algorithms. OEMs may resist external interpretation of failure trends. Finance teams may not immediately recognise the difference between preventive maintenance volume and risk-adjusted maintenance quality. Program governance is therefore essential: named sponsors, monthly KPI reviews, exception tracking and clear accountability from operations through finance.
Common mistakes buyers should avoid
Several recurring mistakes show up in Indian APM procurements:
- Buying a broad platform without a defined reliability use case
- Assuming OEM alarms alone are sufficient for predictive maintenance
- Ignoring asset master-data cleanup and work-order coding discipline
- Treating APM as an analytics side project rather than an operating process
- Launching AI models before establishing basic condition and maintenance workflows
- Measuring success only through dashboard adoption instead of downtime and yield outcomes
Another mistake is overestimating what software can do without instrumentation. If a wind fleet lacks adequate vibration or oil-condition data, or if a solar portfolio has patchy inverter event capture, the first investment may be sensors, communications and historian hygiene rather than advanced analytics licenses.
Vendor evaluation should focus on practical criteria:
- Can the system support mixed fleets and Indian operating conditions?
- How well does it integrate with existing SCADA, EAM and ERP systems?
- Are the health models explainable to engineering teams?
- Can workflows be configured for contractor-led O&M models?
- What local implementation capability exists for scale-up across states?
- How does the commercial model align with portfolio growth and multi-SPV structures?
Why APM is now a board-level topic
In 2026, APM has moved beyond maintenance optimisation into a broader asset-value conversation. Generation companies are under pressure to improve output without assuming aggressive tariff upside. Utilities need better reliability under budget constraints. C&I buyers expect contracted savings and supply stability. Lenders want operational discipline that can be evidenced, not merely asserted.
APM supports these needs by making asset risk visible in financial terms. Instead of generic statements about “plant issues,” management gets quantified exposure: this transformer condition trend threatens x hours of outage; this inverter fault pattern is responsible for y units of recoverable loss; this turbine sub-fleet needs pre-season intervention to avoid z crore of generation risk.
That is why APM deserves consideration as a strategic layer in the digital stack for Indian power and renewables, distinct from ERP, SCADA or generic BI. Where implemented with realistic scope, clean data discipline and operational accountability, it can produce measurable returns within one to two operating cycles.
For developers planning scale, utilities modernising fleet reliability, or lenders assessing operational resilience, the central question is no longer whether asset data exists. It is whether that data is being translated into timely, defensible maintenance decisions that protect cash flow.
If your organisation is evaluating APM, operating-model redesign or the wider digital architecture around reliability, contact Growthifye’s advisory desk. We help energy companies define the business case, architecture and implementation path across IT strategy & roadmaps, ERP & asset management systems and Cybersecurity.
Explore Growthifye's related capabilities
This analysis connects directly to our advisory practice: IT strategy & roadmaps · ERP & asset management systems · Data & analytics platforms · Cloud migration.
About the author

Chief Executive Officer, Growthifye — With over 23 years in management consulting, Sudarshan has taken businesses from concept to scale — building and scaling new-age digital and energy businesses.
- 23+ years in management consulting
- EY alumnus
- Led large-scale BESS programmes, capital raises and advisory mandates
Want this analysis applied to your project?
Talk to our team