EMS Software for Indian C&I and Renewables 2026: Demand, Open Access and ROI
By Sudarshan Karweer · sudarshan@growthifye.com · +91 84510 99371 (Call / WhatsApp) · 2026-09-17
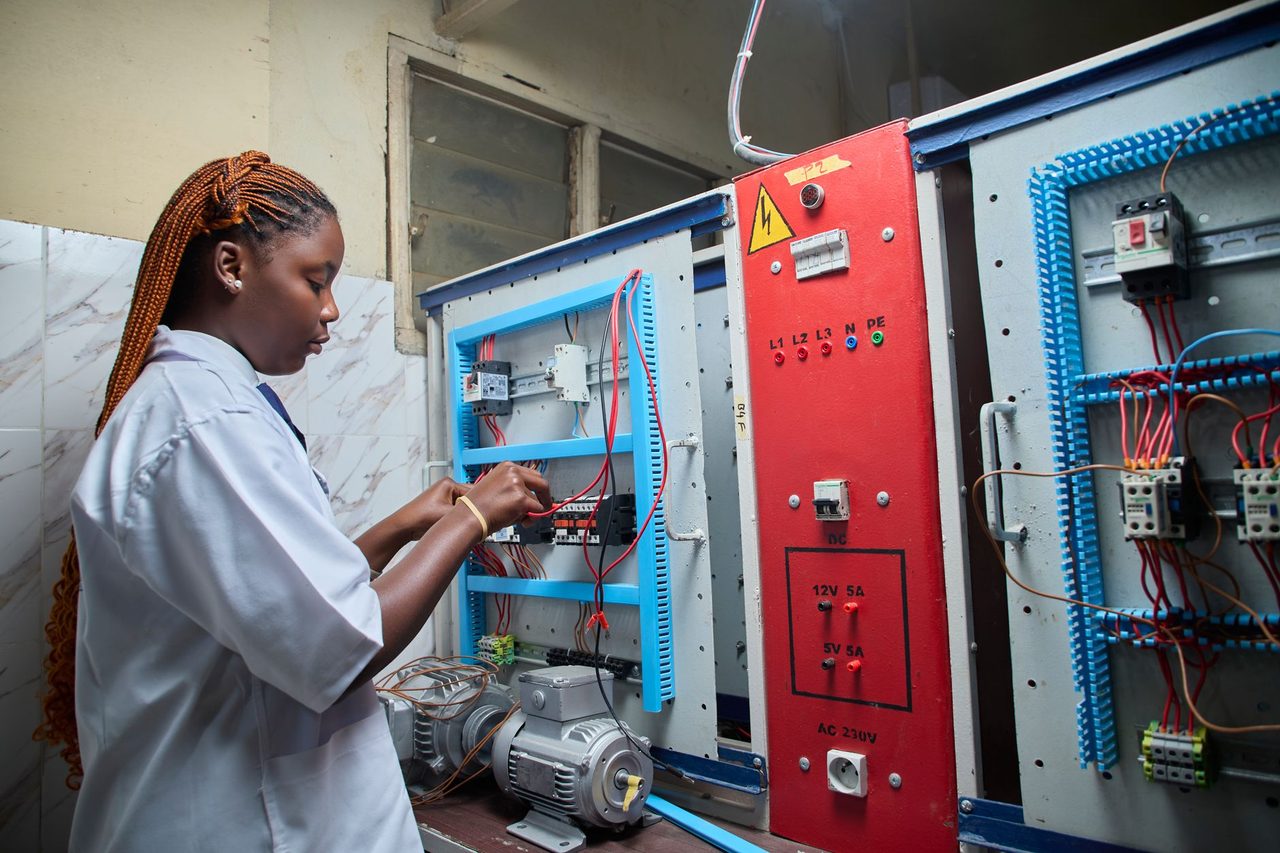
Photo: mickael ange konan on Pexels
India’s power market in 2026 is no longer just about buying the cheapest unit of electricity. For large commercial and industrial consumers, renewable developers with captive or group-captive structures, utilities serving mixed load profiles, and lenders underwriting power-linked cash flows, value now depends on how well energy is measured, forecast, scheduled and controlled. That is exactly where Energy Management System software, or EMS, has become a boardroom topic.
This is not the old building-management discussion limited to HVAC dashboards. In the Indian energy context, EMS software now sits at the intersection of demand control, open-access power procurement, renewable integration, time-block discipline, power quality monitoring, diesel displacement, battery dispatch and internal cost allocation. When deployed properly, it can improve landed power cost by meaningful margins without waiting for a tariff order or a new substation.
For Growthifye’s client base, the practical question is not whether digitisation matters. The real question is which EMS use cases generate the fastest financial impact in India in 2026, what architecture avoids future rework, and how to sequence rollout across plants, feeders, captive assets and procurement teams.
Why EMS is becoming urgent in India in 2026
Three market realities are pushing EMS higher on the agenda.
First, tariff complexity has increased. A large C&I consumer may now source power from a mix of discom supply, rooftop solar, group captive solar or wind, third-party open access, exchange purchases through a trader, and diesel or gas backup for reliability. The savings from open access can be substantial, but so can the cost of poor scheduling, imbalance, overdrawal, underutilisation of contracted demand and misaligned plant operations.
Second, time granularity matters more. Even where monthly bills still dominate management discussions, the financial leakage often begins at 15-minute block level or below. Maximum demand spikes, reactive power issues, power factor deviations, avoidable ramping during expensive periods, and mismatch between renewable generation and process loads all show up in interval data before they become line items on invoices.
Third, lenders and investment committees want stronger visibility into operational discipline. In 2026, debt evaluation for renewable-linked industrial projects increasingly looks beyond headline savings. Credit teams ask whether the sponsor has data integrity, forecasting capability, metering reconciliation, scheduling controls and auditable energy accounting. EMS is becoming part of that governance stack.
What EMS software means in the Indian energy sector
In India, EMS software should be understood as an operating layer that turns electrical data and procurement inputs into actionable decisions. It is broader than submetering, and narrower than a full enterprise ERP. The right EMS stack usually includes:
- Real-time acquisition from utility meters, ABT meters, inverters, SCADA, DG panels, transformers, feeders and submeters
- Load profiling by plant, line, utility interface, process and cost centre
- Maximum demand monitoring and alerts
- Renewable generation forecasting and actual-versus-forecast tracking
- Open-access schedule visibility and deviation tracking
- Battery and DG dispatch logic where storage or backup assets exist
- Power quality analytics covering voltage, harmonics, unbalance, PF and outages
- Tariff engine for discom, wheeling, banking, standby, cross-subsidy and surcharges where applicable
- Energy accounting across captive, group captive and third-party supply arrangements
- Automated reporting for finance, operations and sustainability teams
For a multi-site Indian manufacturer, the difference between basic energy monitoring and a mature EMS is simple: monitoring tells you what happened, while EMS helps decide what to run, when to run it, how to source power, and where commercial leakage is occurring.
The highest-value EMS use cases for Indian C&I consumers
Not every use case deserves day-one implementation. In practice, the fastest-value modules in 2026 are the following.
Maximum demand control
In many states, demand charges remain material for HT consumers. A facility paying demand charges on 5 MVA contracted demand can lose money quickly if unmanaged load peaks trigger higher billing determinants, penalties or poor asset utilisation. EMS platforms can forecast end-of-block demand based on live feeder data and issue alerts or control signals to shift non-critical loads.
Typical savings range:
- 2% to 6% of monthly electricity cost in plants with erratic peaks
- Higher where air compressors, chillers, furnaces or batch processes are not sequenced properly
For a plant with annual electricity spend of Rs 25 crore, even a 3% reduction represents Rs 75 lakh per year.
Open-access optimisation
Open-access savings are often evaluated only on headline landed tariff difference. In reality, actual benefit depends on schedule discipline, consumption alignment, state-specific charges and banking conditions. EMS can compare day-ahead schedules with actual load and renewable generation, identify recurring deviations, and help operations teams align process loads to available low-cost supply.
In states where banking is constrained or settlement economics have become less favourable, intra-day visibility becomes even more important. A plant drawing 40% to 70% of energy through open access can materially improve realised savings if EMS reduces mismatch between contracted renewable availability and actual site demand.
Typical savings range:
- 0.15 to 0.60 Rs/kWh on open-access volumes through better alignment and reduced leakage
- More where multiple sites share captive allocation and manual reconciliation is weak
Renewable self-consumption improvement
Many industrial campuses have rooftop solar, behind-the-meter solar, or a captive renewable allocation. Yet self-consumption is often below technical potential because load and generation are not orchestrated. EMS can shift flexible loads, pre-cool or pre-heat selected processes, coordinate battery charge-discharge, and avoid renewable curtailment within site limits.
Typical outcomes:
- 3% to 10% increase in renewable self-consumption in flexible-load environments
- Improved effective tariff of solar-plus-storage investments
- Reduced DG runtime during transitions and outages
Diesel displacement and resilience orchestration
Grid reliability has improved, but many sectors still maintain DG backups due to process criticality. In pharmaceuticals, data centres, metals, cold chain and electronics manufacturing, the issue is not merely outage backup but coordinated operation during disturbances or expensive time windows. EMS can integrate grid status, battery state of charge, DG availability and critical load hierarchy.
If diesel generation costs Rs 18 to Rs 28 per kWh depending on scale and fuel logistics, replacing even part of that runtime through better load shedding, battery discharge, or renewable-led control can produce strong payback.
Power quality and maintenance-led savings
Poor PF, harmonics and transformer overloading do not always receive management attention because their cost is dispersed across equipment stress, nuisance trips, heat losses and production interruptions. EMS with quality analytics can identify feeders causing repetitive excursions and quantify associated financial loss.
In some plants, the savings case is less about reducing the energy bill directly and more about avoiding a single process trip, furnace upset or batch rejection. For lenders and insurers, this is especially important because it links digital control to risk reduction.
What good EMS architecture looks like in 2026
Indian buyers should avoid two extremes: over-customised dashboards with no process integration, and oversized control platforms trying to solve every future problem on day one.
A practical architecture typically has five layers.
1. Data acquisition layer
This includes ABT meters, utility check meters, multifunction meters, feeder meters, solar inverters, weather stations, BESS controllers, DG PLCs and existing SCADA points. Protocol support should cover common industrial and utility standards, with edge gateways where needed.
2. Context and model layer
Raw tags are not enough. The system must know which meter belongs to which feeder, which feeder supports which process, which source maps to which contract, and how sites roll up into legal or business entities. This is where many EMS programmes fail. Without a proper asset and tariff model, reporting remains cosmetic.
3. Analytics and optimisation layer
Core analytics should include load forecasting, peak prediction, baseline modelling, tariff simulation, renewable generation correlation, schedule-versus-actual analysis, and anomaly detection. For more advanced users, optimisation algorithms can recommend battery dispatch, load curtailment windows and source selection.
This is where Growthifye’s Data & analytics platforms capability becomes relevant for clients who need more than an out-of-the-box dashboard.
4. Workflow and control layer
Alerts should not stop at email. The platform should route actions to plant engineers, procurement teams and finance controllers. Examples include maximum-demand response workflows, open-access mismatch reviews, and escalation during inverter underperformance or meter communication loss.
5. Enterprise integration layer
EMS is most useful when integrated with billing, accounting, maintenance and sustainability reporting systems. Sites with multiple entities or SPVs should consider early alignment with ERP & asset management systems so energy cost, downtime and production intensity can be analysed together rather than in silos.
ROI benchmarks for Indian EMS projects
In 2026, buyers are rightly sceptical of generic software claims. The economics must be grounded in Indian tariff structures and operational realities.
For a single large industrial site with annual power spend of Rs 15 crore to Rs 50 crore, a scoped EMS implementation may involve:
- Software licensing or subscription: Rs 12 lakh to Rs 60 lakh annually depending on scale and sophistication
- Metering, gateways and integration: Rs 15 lakh to Rs 1.5 crore depending on instrumentation gaps
- Implementation and change management: Rs 10 lakh to Rs 75 lakh
Typical payback windows:
- 6 to 12 months for demand-control-heavy and open-access-heavy sites with decent metering already in place
- 12 to 18 months for multi-site programmes requiring integration and new instrumentation
- 18 to 24 months where the case depends more on reliability, power quality and maintenance savings than bill optimisation
Illustrative savings stack for a Rs 30 crore annual power-spend facility:
- Maximum demand optimisation: Rs 30 lakh to Rs 90 lakh
- Open-access alignment and schedule discipline: Rs 25 lakh to Rs 1.2 crore
- Renewable self-consumption improvement: Rs 15 lakh to Rs 60 lakh
- Diesel displacement and resilience optimisation: Rs 10 lakh to Rs 50 lakh
- Power quality and outage reduction: highly site-specific, but often Rs 20 lakh+ equivalent when production losses are included
A realistic first-year target is 3% to 8% reduction in controllable energy cost for sites with mixed sourcing and weak digital visibility. Best-in-class cases can do more, but underwriting should use conservative assumptions.
What lenders, developers and utilities should look for
EMS is not only a buyer-side tool.
For renewable developers serving C&I clients, EMS can strengthen customer retention by proving delivered value beyond tariff discount. A developer that helps a client improve scheduling, renewable utilisation and site-level control becomes harder to replace than one that only sells units.
For lenders, EMS maturity is a proxy for operational governance in captive and group-captive structures. It improves confidence in energy accounting, invoice validation, savings realisation and counterparty discipline. During due diligence, useful questions include:
- Are utility, captive and process meters reconciled regularly?
- Is 15-minute or finer data available and retained?
- Can the borrower demonstrate open-access schedule adherence patterns?
- Are energy costs allocated by product line or cost centre?
- Is there a documented response process for demand spikes and source outages?
For utilities and policymakers, EMS adoption at consumer and feeder level can support demand response readiness, DSM design, and better integration of variable renewables without depending solely on network reinforcement. As India’s electricity market modernises, the line between customer energy management and system flexibility will continue to blur.
Common implementation mistakes in India
The recurring mistakes are operational, not technical.
- Starting with dashboards before defining commercial use cases
- Ignoring tariff logic and regulatory charges in savings calculations
- Treating meters as an IT issue instead of a revenue-grade data issue
- Failing to assign ownership across operations, procurement and finance
- Underestimating data cleansing and naming standards
- Deploying at one site without a multi-site template
- Not budgeting for cybersecurity of edge devices and remote connectivity
Many firms also buy software before defining target operating model changes. If plant teams are not authorised to act on alerts, or procurement teams are not reviewing schedule-loss reports, the platform becomes a reporting tool rather than a savings engine.
That is why successful programmes usually begin with IT strategy & roadmaps tied to measurable business cases, followed by a phased implementation with clear governance.
A practical rollout plan for 2026
For most Indian organisations, the most effective rollout sequence is:
- Select 1 to 3 representative sites with meaningful annual power spend and mixed sourcing
- Establish baseline using at least 6 to 12 months of bills, meter data and operating patterns
- Prioritise 3 use cases only: demand control, open-access optimisation, and renewable self-consumption
- Close instrumentation gaps before expanding analytics scope
- Integrate alerting with plant operations and monthly finance review cycles
- Validate realised savings for one quarter before multi-site replication
- Standardise meter hierarchy, tariff models, KPIs and reporting templates across the portfolio
By phase two, the platform can extend into storage dispatch, DG orchestration, internal carbon and energy intensity reporting, and portfolio-level benchmarking.
In 2026, the winners in Indian energy are not just those who sign cheaper PPAs or add more megawatts. They are the organisations that convert interval data into disciplined operational action. Energy Management System software is now one of the most practical ways to do that across C&I consumption, captive renewables and hybrid power portfolios.
For Indian consumers, developers, lenders and utilities, the case for EMS is no longer conceptual. It is commercial, auditable and increasingly strategic.
If your organisation is evaluating EMS software, metering architecture, open-access optimisation, or a digital roadmap across energy operations, contact Growthifye’s advisory desk. We help clients define the business case, vendor strategy, rollout model and implementation governance for measurable results.
Explore Growthifye's related capabilities
This analysis connects directly to our advisory practice: IT strategy & roadmaps · ERP & asset management systems · Data & analytics platforms · Cloud migration.
About the author

Chief Executive Officer, Growthifye — With over 23 years in management consulting, Sudarshan has taken businesses from concept to scale — building and scaling new-age digital and energy businesses.
- 23+ years in management consulting
- EY alumnus
- Led large-scale BESS programmes, capital raises and advisory mandates
Want this analysis applied to your project?
Talk to our team