Cross-Border Open Access for Multi-State C&I Portfolios in India 2026
By Sudarshan Karweer · sudarshan@growthifye.com · +91 84510 99371 (Call / WhatsApp) · 2026-09-15
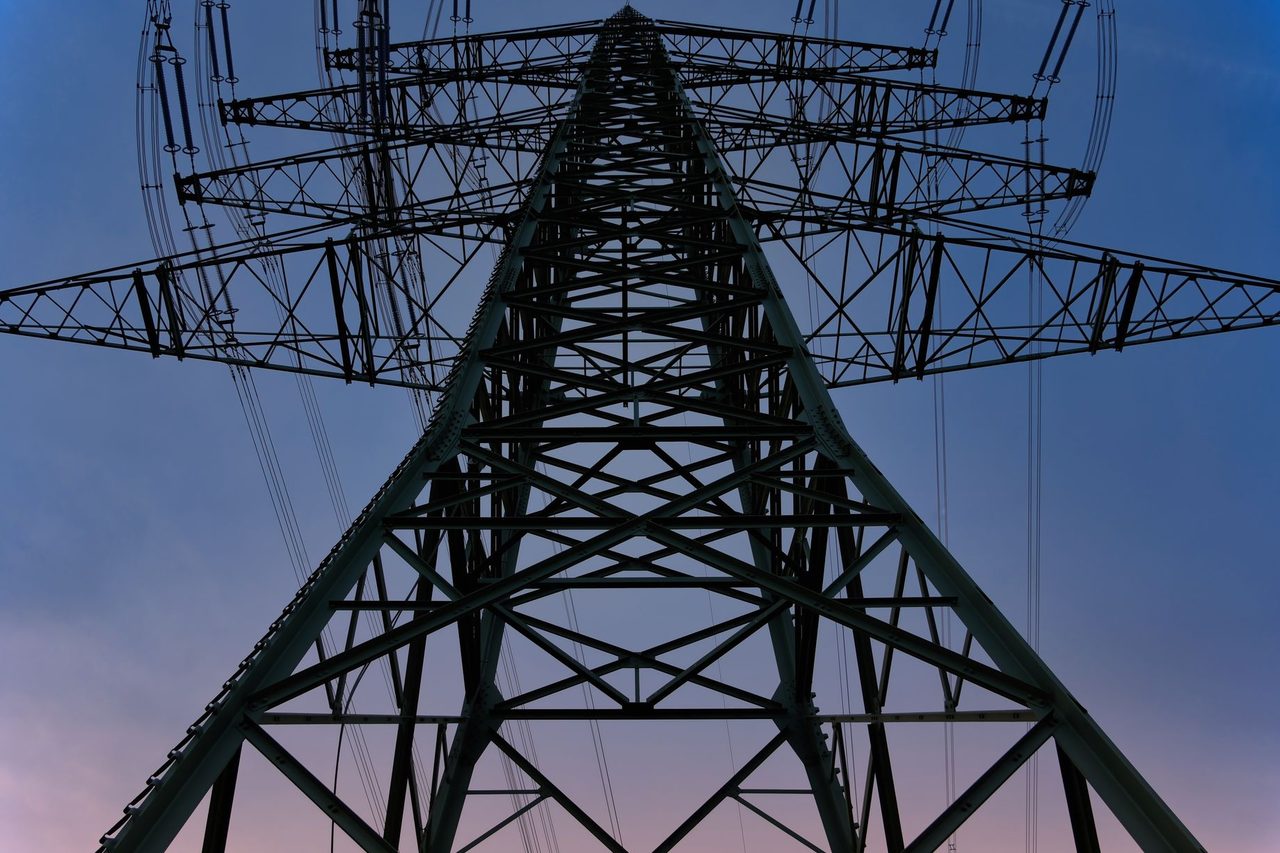
Photo: Holger Schué on Pexels
India’s open-access market is maturing beyond single-plant, single-state transactions. In 2026, an increasing number of commercial and industrial buyers are evaluating multi-state renewable procurement portfolios where generation is located in one state and consumption is spread across two, five or even ten states. This shift changes the economics and the risk profile of the corporate PPA.
Most published discussions on open access focus on the standard third-party versus group captive choice, banking provisions, landed cost waterfall, or hybrid design. The next practical issue is different: how should a large power buyer source renewable energy when its load is geographically dispersed and state-level rules vary sharply? For such buyers, inter-state open access can create value, but only if transmission access, state-level surcharges, scheduling realities and approval timelines are modelled correctly.
This article examines inter-state open access for multi-state C&I portfolios in India in 2026, with emphasis on ISTS-linked supply, charge treatment, state sink risks, contracting strategy and landed cost design.
Why multi-state buyers are reconsidering sourcing architecture
A single-state procurement strategy often leaves money on the table for buyers with national or regional load footprints. The reason is simple: renewable generation quality, project availability, curtailment profile and charge stack differ widely by source state.
A few examples seen repeatedly in 2026:
- Western and southern states continue to offer stronger solar CUF ranges and deeper developer pipelines than many deficit states.
- Wind-rich states may support better evening-energy contribution for manufacturing loads compared with same-state solar-only options.
- In some high-tariff demand centres, even after wheeling, transmission and cross-subsidy surcharge impacts, an inter-state PPA can outperform local utility supply by Rs 1.0-2.5/kWh.
- For buyers with facilities in multiple DISCOM areas, aggregating demand can improve bargaining power in tariff discovery and contract flexibility.
That said, the mistake many buyers make is assuming that “cheaper generation state” automatically means “cheaper landed power”. In practice, inter-state open access is won or lost at the sink-state charge layer and in the operational fit between generation profile and site-level load.
This is where Demand & ToD analysis and Sourcing strategy become central. Without hour-wise consumption mapping by site and season, multi-state procurement can look attractive in headline tariff terms but underperform after imbalance, over-injection, banking exclusion and fixed-charge exposure.
Inter-state open access in 2026: what actually changes versus intra-state deals
When generation and consumption are in the same state, the charge stack is relatively easier to estimate. In inter-state structures, additional complexity enters at four levels:
- Central transmission access and system usage
- State transmission and wheeling at the sink side
- Divergent surcharge treatment across receiving states
- Operational and regulatory coordination across SLDCs, RLDCs, CTU and DISCOM interfaces
For a multi-state buyer, the commercial model typically has three broad variants:
- A separate state-by-state PPA and delivery structure for each consumption state
- A pooled offtake arrangement where one developer or supply platform serves multiple sites under coordinated contracts
- A portfolio approach combining inter-state open access for some sites with intra-state/group captive structures for others
In 2026, the third model is often the most bankable. Pure national aggregation sounds elegant, but Indian power regulation remains state-sensitive. A portfolio architecture allows the buyer to place each site into the most efficient regulatory bucket.
For example:
- Site A in a state with high CSS and weak banking may be better suited to group captive solar located in-state.
- Site B in a high-tariff metro may justify third-party inter-state supply despite additional transmission layers.
- Site C with night-heavy load may need a wind-solar hybrid source from another state.
The key point is that inter-state open access should be treated as a portfolio optimisation tool, not a default template.
The 2026 charge stack: where savings survive and where they disappear
For corporate buyers, landed cost remains the only metric that matters. In inter-state deals, the landed tariff usually starts with the ex-busbar PPA tariff and then builds upward through losses and charges.
A practical 2026 landed-cost framework includes:
- Generator PPA tariff: often around Rs 3.0-4.2/kWh for plain solar or wind-solar mix depending on tenure, location, profile and credit terms
- CTU/ISTS-related transmission components, wherever applicable under prevailing regulations and project eligibility
- State transmission charges at sink side
- Wheeling charges at sink side
- Transmission and wheeling losses
- Cross-subsidy surcharge, if payable
- Additional surcharge, where applicable
- SLDC/RLDC and scheduling charges
- Metering and application-related fees
- DSM or deviation risk impact, directly or through contract pass-through
For a high-credit C&I buyer, a headline inter-state solar PPA at Rs 3.25/kWh may finally land at around Rs 4.6-6.2/kWh depending on sink state, contract design and operational assumptions. In contrast, the same source asset may produce sharply different economics across destinations.
A realistic illustration for 2026:
- Source tariff: Rs 3.35/kWh
- Combined transmission/wheeling losses: 7-12%
- State transmission plus wheeling charges: Rs 0.40-1.20/kWh equivalent depending on state and voltage level
- CSS: zero in some captive structures, but in third-party deals may range from roughly Rs 0.20 to above Rs 2.00/kWh depending on state methodology and consumer category
- Additional surcharge: in some states nil or moderated, in others material enough to kill savings
- Scheduling, SLDC and miscellaneous operational cost: Rs 0.05-0.20/kWh equivalent
That means the same contract can be highly viable for one site and marginal for another.
The biggest 2026 reality is this: surcharge asymmetry between states is now more important than tariff asymmetry between source projects.
ISTS-linked procurement: when it works for corporate PPAs
Many large buyers ask whether ISTS-linked renewable sourcing can unlock superior portfolio economics. The answer is yes, but only in specific cases.
Inter-state sourcing is generally worth serious evaluation when:
- The buyer has load in states with high industrial tariffs, especially above Rs 8-9/kWh effective utility cost
- Sink-state surcharge treatment remains manageable
- The buyer needs scale quickly and local project availability is weak
- The generation source offers superior CUF or better seasonal alignment with demand
- The buyer values supplier diversification across geographies
It becomes less attractive when:
- Sink-state CSS and additional surcharge erode most of the spread
- Banking is unavailable and the buyer’s load shape is too peaky or too seasonal
- Approval timelines are unpredictable and commissioning certainty matters more than absolute savings
- The consumer has enough anchor demand to make an in-state captive model feasible
In lender diligence, one issue often gets underestimated: not all “open access savings” are equally financeable. A developer can model a strong spread under ideal scheduling assumptions, but if the buyer’s site-level consumption pattern is volatile, effective offtake shrinks and curtailment or imbalance exposure rises. For project-finance assessment, hour-wise matching matters more than annual average demand.
This is why serious buyers increasingly run scenario sets, not single landed-cost estimates:
- Base case using approved charge orders and current utility tariff
- Stress case with surcharge increase at sink state
- No-banking case
- Curtailment case
- Lower plant generation case
- Partial-load utilisation case for seasonal factories
Approvals and operating friction across states
Inter-state open access is not just a pricing exercise. It is an execution exercise involving multiple entities and procedural dependencies. In 2026, the most common source of delay is not the PPA negotiation itself but the sequence mismatch between connectivity, metering, standing clearance, utility NOCs and short-term or medium-term access processing.
Typical friction points include:
- Different documentary requirements across DISCOMs and SLDCs
- Ambiguity in treatment of contract demand, sanctioned load and substation readiness
- Delays in no-dues or technical feasibility confirmations
- Commissioning slippage at the generation side impacting access start date
- Inconsistent treatment of parallel operation, standby or relay requirements for captive users
- State-level reinterpretation of surcharge exemptions or eligibility conditions
For multi-state buyers, one operational discipline is critical: do not sign all state offtake legs on identical assumptions. Each sink state needs its own approvals map, timeline buffer and fallback supply plan.
In practice, successful buyers stagger implementation. They first prioritise sites with:
- Cleanest regulatory pathway
- Highest utility tariff replacement value
- Stable baseload or day-time load profile
- Minimal internal metering and evacuation complications
Open-access approvals should be tracked like a project schedule, not a legal checklist. Small procedural misses can delay first injection by 30-90 days, which directly affects realised savings.
Contract design for geographically dispersed loads
Once a buyer moves from one state to many, standard PPAs become inadequate. The contracting package must account for site diversity, regulatory divergence and uncertain policy movement over a 15-25 year horizon.
In 2026, robust multi-state contracting usually addresses the following:
- Site addition and site deletion mechanics
- Reallocation of contracted capacity among buyer entities or locations
- Change-in-law treatment for central and state charges separately
- Curtailment hierarchy and deemed generation logic
- Metering and settlement protocol by state and by delivery point
- Scheduling responsibility and data-sharing obligations
- Termination consequences if a single sink site loses eligibility
- Security package calibrated to actual utilisation rather than nameplate capacity alone
This is where PPA structuring & negotiation has a direct impact on financeability. Developers prefer contracted certainty; buyers want flexibility to reallocate loads as factories expand or contract. The middle ground is often a portfolio envelope with minimum offtake thresholds and state-specific annexures.
One effective approach is to separate commercial common terms from regulatory schedules. The master agreement can define tariff principles, payment security and general risk allocation, while each state annexure captures local charges, losses, metering chain and settlement logic. This avoids reopening the full contract whenever one receiving state changes a procedural rule.
Another overlooked issue is utility tariff migration risk. If the buyer’s utility supply tariff increases slower than expected, inter-state open access savings may narrow. Conversely, if utility tariffs rise due to fuel and network cost pass-throughs, savings widen. PPAs should therefore be tested against multiple future utility-tariff curves, not just today’s bill.
A portfolio playbook for 2026: how buyers should decide
For a large C&I consumer with multi-state demand, the best answer is rarely “all inter-state” or “all local”. A better framework is to classify each site into one of four buckets:
- Strong candidate for inter-state third-party open access
- Better suited to in-state group captive
- Hybrid candidate requiring wind-solar or multi-source shaping
- Low-readiness site to be retained on utility supply for now
A practical screening sequence is:
- Map 15-minute demand and ToD pattern for each site
- Calculate current utility landed tariff, including demand charges and rebates
- Identify sanctioned load, voltage level and substation configuration
- Estimate state-specific open access charges and surcharge treatment
- Compare inter-state versus intra-state source options
- Stress-test no-banking and reduced-generation scenarios
- Sequence sites by ease of approval and savings potential
For many buyers in 2026, the winning strategy is a blended book. Around 30-60% of total portfolio demand may be served through open access, but with different structures by state. This reduces concentration risk while preserving savings.
Developers and lenders should also recognise that multi-state offtake can improve credit quality if the buyer is diversified across sites and business units. But that benefit materialises only when legal entity structure, billing chain and payment responsibility are clearly drafted.
The final lesson is straightforward: inter-state open access is not a commodity purchase. It is a regulatory-economics problem with engineering and contracting consequences. Buyers who treat it as a simple tariff comparison usually miss hidden costs. Buyers who build a site-by-site, hour-by-hour portfolio model can unlock durable savings even in a fragmented regulatory landscape.
What this means for developers, lenders and policymakers
Developers should avoid marketing inter-state open access solely on low generation tariff. Sophisticated C&I buyers now expect a full sink-state landed-cost view, month-wise generation fit and realistic approval schedule.
Lenders should test revenue assumptions against state-specific access continuity, surcharge shocks and buyer utilisation volatility. Portfolio diversification helps, but only if contracts preserve payment discipline and allocation clarity.
Policymakers and utilities should note that large industrial consumers increasingly procure power at the portfolio level. Greater procedural standardisation across states, faster approval workflows and charge transparency would reduce friction without undermining legitimate network cost recovery.
In 2026, the next phase of India’s corporate renewable market will be shaped less by generic enthusiasm for open access and more by the quality of interstate execution. The winners will be those who can convert regulatory complexity into measurable landed-cost advantage.
If your organisation is evaluating multi-state renewable sourcing, charge optimisation or contract design for corporate PPAs, contact Growthifye’s advisory desk. We help C&I buyers, developers and financiers navigate portfolio-level open access strategy, approvals and landed-cost execution.
Explore Growthifye's related capabilities
This analysis connects directly to our advisory practice: Demand & ToD analysis · Sourcing strategy · Competitive developer selection · PPA structuring & negotiation.
About the author

Chief Executive Officer, Growthifye — With over 23 years in management consulting, Sudarshan has taken businesses from concept to scale — building and scaling new-age digital and energy businesses.
- 23+ years in management consulting
- EY alumnus
- Led large-scale BESS programmes, capital raises and advisory mandates
Want this analysis applied to your project?
Talk to our team