
State deep-dive · investor deck
Goa
Goa: 0.1 GW solar + wind installed · FY31 plan 0.2 GW · 1,050 ckm · 70% utilised · +200 ckm planned by FY31
Solar
60 MW
Wind
0 MW
Hydro + SHP
0 MW
Nuclear
0 MW
Storage (BESS+PSP)
0 MW
Grid utilisation
70%
PPP assets mapped
0
RE cities tracked
0
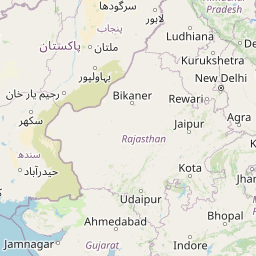
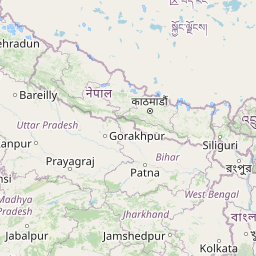
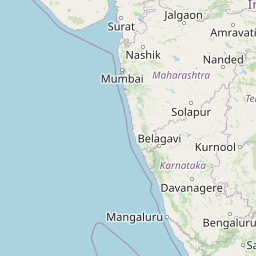
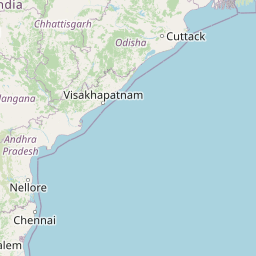
Lime = tracked real-estate city · coloured dots = PPP assets · red/amber = grid bottleneck corridor
Capacity trajectory to FY31
- bess_mw
- hydro
- nuclear
- solar
- wind
Green H₂ announced: 0 ktpa · 0 MW electrolysers · FY31 plan 0 ktpa
Open the interactive India mapGrid & transmission
Network
1,050 ckm
Substations
4,200 MVA
Utilisation
70%
+ckm by FY31
+200
+MVA by FY31
+800
HVDC · STATCOM planned
0 · 0
Load despatch: Goa SLDC Panaji
PPP & government assets · 0
Open the PPP asset mapReal estate — tracked cities · sale ₹/sq ft (carpet) & yields
No tracked micro-markets in this state yet — the desk adds cities on request.
Energy figures: CEA/MNRE month 2026-06-30 (indicative desk seed, LIVE where headline-verified) · PPP assets: OpenStreetMap + curated · Property: Growthifye real-estate engine (indicative). Not a valuation or offer.