
Surat rates, per sq ft carpet.





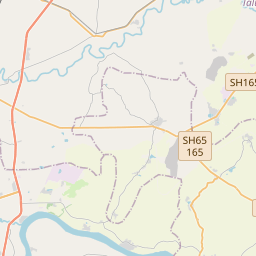


Pin = market rate, ₹/sq ft carpet. Click a pin to load it into the land-cost calculator.
| Micro-market | Market ₹/sq ft | Reckoner | Premium | Rent ₹/sq ft/mo | Yield · typical |
|---|---|---|---|---|---|
| Vesu Central business district | ₹7,210 | ₹4,750 | +51.8% (+8% vs city line) | ₹14.4 | 2.4% 2 BHK ₹13,700/mo |
| Piplod – Citylight Prime residential | ₹7,070 | ₹4,940 | +43.1% (+1.3% vs city line) | ₹15.9 | 2.7% 2 BHK ₹15,100/mo |
| Dumas Rd Established mid-market | ₹6,760 | ₹5,100 | +32.5% (-6.6% vs city line) | ₹17.5 | 3.11% 2 BHK ₹16,600/mo |
| Adajan Prime residential | ₹6,180 | ₹4,370 | +41.4% (+1.8% vs city line) | ₹13.9 | 2.7% 2 BHK ₹13,200/mo |
| Bharthana – Althan Established mid-market | ₹5,630 | ₹4,200 | +34% (-2.9% vs city line) | ₹14.5 | 3.09% 2 BHK ₹13,800/mo |
| Pal – Palanpur Established mid-market | ₹5,220 | ₹3,900 | +33.8% (-1.8% vs city line) | ₹13.5 | 3.1% 2 BHK ₹12,800/mo |
| Varachha – Katargam Established mid-market | ₹4,850 | ₹3,600 | +34.7% (+0.2% vs city line) | ₹12.5 | 3.09% 2 BHK ₹11,900/mo |
| Sachin – Kadodara Peripheral / emerging | ₹3,210 | ₹2,590 | +23.9% (-0.5% vs city line) | ₹9.9 | 3.7% 2 BHK ₹9,400/mo |
Land cost calculator — acquisition, stamp duty & TDR
Type a plot size; we apply the micro-market land rate, the state's stamp-duty rule (charged on the higher of market and reckoner value) and the local TDR pricing convention.
Acquisition (market)
₹43.21 cr
₹9,920/sq ft × 43,560 sq ft
Stamp duty + registration
₹2.55 cr
4.9% + 1% on ₹43.21 cr
Total outlay
₹45.76 cr
₹5,253 per buildable sq ft @ FSI 2
Gujarat: 4.9% + 1% registration (nil registration for women). TDR under GDCR. Indicative — confirm with the sub-registrar's current schedule.
Vidura market brief
Surat's residential market continues to trade well above Garvi jantri benchmarks across all tracked micro-markets, with premiums ranging from 24% to 52%, underscoring a persistent gap between government-notified rates and actual transaction values in India's diamond and textile capital. Vesu commands the steepest premium at 51.8% (₹7,210 vs ₹4,750/sq ft carpet), followed by Piplod-Citylight at 43.1% and Adajan at 41.4%—these western-corridor micro-markets benefit from established social infrastructure, connectivity to business districts, and sustained end-user demand, making them costlier for land acquisition but more reliable for asset monetisation given deeper liquidity. Sachin-Kadodara, at the industrial periphery, shows the thinnest premium (23.9%), signalling closer alignment with reckoner rates and potentially better economics for greenfield PPP and logistics-linked projects where land cost sensitivity is high. With city-wide residential values seeded to rise ~7.5% YoY, stamp-duty and acquisition-cost planning should build in this appreciation trajectory, particularly for projects anchored in premium western corridors. As Surat's industrial diversification continues, expect jantri revisions to gradually narrow these gaps, tightening arbitrage for early-mover investors.
Generated 2026-09-26 from the engine's current numbers and recent headlines · refreshed weekly
5-year trend — city average, residential
Lime = engine's city average sale · sky = rent ₹/sq ft/month · dashed blue = YoY % · amber dots = credible prints (CRE Matrix / PropEquity / Knight Frank / IGR headlines, team deals) — 0 so far · 5Y sale +22.5% · rent +22.8%
- rent
- value
- yoy
Reckoner ↔ market correlation
market ≈ −₹912.7 + 1.5974 × reckoner · R² 0.955 · n = 8 micro-markets
Points above the line are micro-markets where the market has run further ahead of the government rate — expect higher land-acquisition cost and stamp-duty arbitrage; points below signal reckoner catch-up risk.
Recent public signals
Indicative desk estimates calibrated to government reckoner/circle rates and public signals; not a valuation. Refined daily and by team corrections. Reckoner source: Garvi — Jantri Rates. Unit: ₹ per sq ft carpet (land: ₹ per sq ft of plot).