
Nagpur rates, per sq ft carpet.
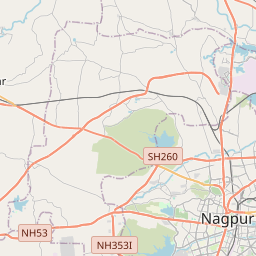
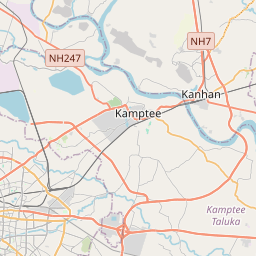
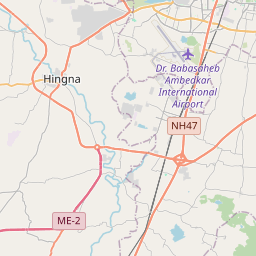
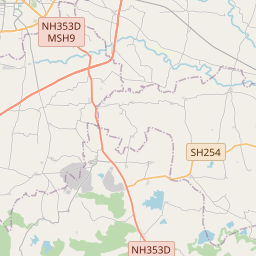
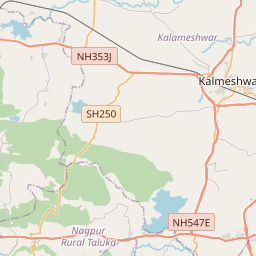
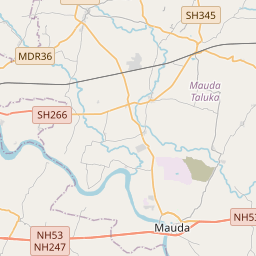
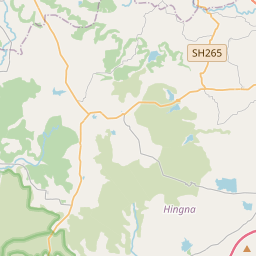
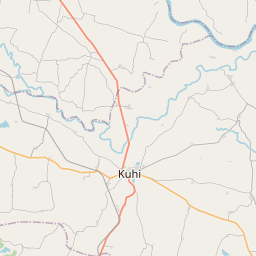
Pin = market rate, ₹/sq ft carpet. Click a pin to load it into the land-cost calculator.
| Micro-market | Market ₹/sq ft | Reckoner | Premium | Rent ₹/sq ft/mo | Yield · typical |
|---|---|---|---|---|---|
| Civil Lines – Dharampeth Central business district | ₹9,180 | ₹6,480 | +41.7% (+2.5% vs city line) | ₹18.4 | 2.41% 2 BHK ₹17,500/mo |
| Dhantoli – Ramdaspeth Prime residential | ₹8,290 | ₹6,170 | +34.4% (-1.9% vs city line) | ₹18.7 | 2.71% 2 BHK ₹17,800/mo |
| Wardha Rd – Manish Nagar Prime residential | ₹6,780 | ₹5,110 | +32.7% (+0.6% vs city line) | ₹15.3 | 2.71% 2 BHK ₹14,500/mo |
| MIHAN Established mid-market | ₹5,550 | ₹4,480 | +23.9% (-3% vs city line) | ₹14.3 | 3.09% 2 BHK ₹13,600/mo |
| Besa – Beltarodi Growth suburb | ₹4,740 | ₹3,990 | +18.8% (-3.8% vs city line) | ₹13.4 | 3.39% 2 BHK ₹12,700/mo |
| Hingna Rd Growth suburb | ₹4,210 | ₹3,490 | +20.6% (+2.2% vs city line) | ₹11.9 | 3.39% 2 BHK ₹11,300/mo |
| Jamtha – Wardha Rd Ext Peripheral / emerging | ₹3,830 | ₹3,280 | +16.8% (+1.4% vs city line) | ₹11.8 | 3.7% 2 BHK ₹11,200/mo |
| Kamptee Rd – Koradi Peripheral / emerging | ₹3,610 | ₹3,110 | +16.1% (+3% vs city line) | ₹11.1 | 3.69% 2 BHK ₹10,500/mo |
Land cost calculator — acquisition, stamp duty & TDR
Type a plot size; we apply the micro-market land rate, the state's stamp-duty rule (charged on the higher of market and reckoner value) and the local TDR pricing convention.
Acquisition (market)
₹14.59 cr
₹3,350/sq ft × 43,560 sq ft
Stamp duty + registration
₹87.9 lakh
6% + 1% on ₹14.59 cr
Total outlay
₹15.47 cr
₹1,776 per buildable sq ft @ FSI 2
Maharashtra: 5% stamp + 1% metro cess (Mumbai/Pune/Nagpur) + 1% registration (cap ₹30k). TDR trades ≈ 30–40% of receiving-plot land reckoner. Indicative — confirm with the sub-registrar's current schedule.
Vidura market brief
Nagpur's residential values continue to run well ahead of IGR Maharashtra's Ready Reckoner across all tracked micro-markets, with premiums ranging from 16-42%, underscoring persistent under-valuation in the statutory benchmark despite periodic revisions and a seeded annual appreciation trend of ~6%. The widest gaps sit in the established core—Civil Lines-Dharampeth (41.7% premium, ₹9,180/sq ft) and Dhantoli-Ramdaspeth (34.4%, ₹8,290/sq ft)—reflecting legacy scarcity, social infrastructure and inelastic supply in these central addresses. This matters directly for land acquisition and stamp-duty planning, since reckoner-linked compensation and registration costs understate true market entry cost in these wards. Peripheral growth corridors like MIHAN (23.9%) and Wardha Rd-Manish Nagar (32.7%) show narrower but still meaningful spreads, suggesting reckoner rates there are catching up faster with logistics- and connectivity-led demand—relevant for asset monetisation timing and PPP land-value capture models along the MIHAN-Wardha Rd axis. As Nagpur's outer corridors mature, expect reckoner revisions to progressively compress these premiums, tightening the arbitrage window for early movers in industrial and logistics-linked residential catchments.
Generated 2026-09-26 from the engine's current numbers and recent headlines · refreshed weekly
5-year trend — city average, residential
Lime = engine's city average sale · sky = rent ₹/sq ft/month · dashed blue = YoY % · amber dots = credible prints (CRE Matrix / PropEquity / Knight Frank / IGR headlines, team deals) — 0 so far · 5Y sale +17.3% · rent +17.1%
- rent
- value
- yoy
Reckoner ↔ market correlation
market ≈ −₹1,525.2 + 1.617 × reckoner · R² 0.995 · n = 8 micro-markets
Points above the line are micro-markets where the market has run further ahead of the government rate — expect higher land-acquisition cost and stamp-duty arbitrage; points below signal reckoner catch-up risk.
Recent public signals
Indicative desk estimates calibrated to government reckoner/circle rates and public signals; not a valuation. Refined daily and by team corrections. Reckoner source: IGR Maharashtra — Annual Statement of Rates (Ready Reckoner). Unit: ₹ per sq ft carpet (land: ₹ per sq ft of plot).