
Mumbai (MMR) rates, per sq ft carpet.
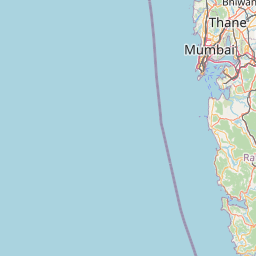
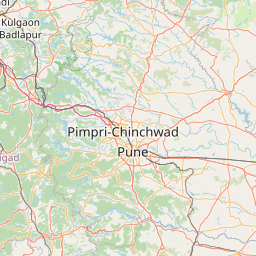
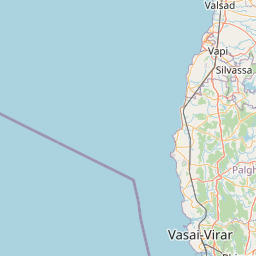
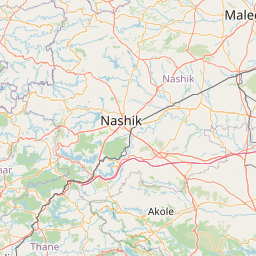
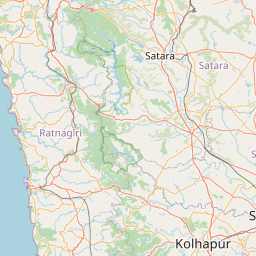

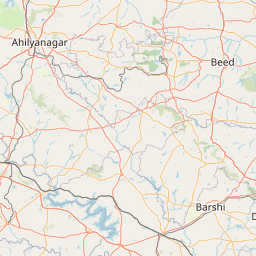

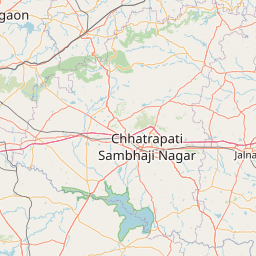

Pin = market rate, ₹/sq ft carpet. Click a pin to load it into the land-cost calculator.
| Micro-market | Market ₹/sq ft | Reckoner | Premium | Rent ₹/sq ft/mo | Yield · typical |
|---|---|---|---|---|---|
| Island City & BKC · 5 | |||||
| Malabar Hill – Cuffe Parade Prime residential | ₹78,630 | ₹45,460 | +73% (+0.2% vs city line) | ₹176.9 | 2.7% 2 BHK ₹1,68,100/mo |
| BKC Central business district | ₹62,300 | ₹33,830 | +84.2% (+7.4% vs city line) | ₹124.6 | 2.4% 2 BHK ₹1,18,400/mo |
| Worli – Lower Parel Prime residential | ₹51,410 | ₹30,310 | +69.6% (-0.8% vs city line) | ₹115.7 | 2.7% 2 BHK ₹1,09,900/mo |
| Dadar – Matunga Established mid-market | ₹38,360 | ₹23,560 | +62.8% (-3.9% vs city line) | ₹99.1 | 3.1% 2 BHK ₹94,100/mo |
| Wadala – Sewri Established mid-market | ₹30,260 | ₹18,600 | +62.7% (-3% vs city line) | ₹78.2 | 3.1% 2 BHK ₹74,300/mo |
| Western Suburbs · 5 | |||||
| Bandra West Prime residential | ₹57,470 | ₹33,800 | +70% (-0.8% vs city line) | ₹129.3 | 2.7% 2 BHK ₹1,22,800/mo |
| Juhu – Santacruz West Prime residential | ₹44,550 | ₹26,230 | +69.8% (-0.2% vs city line) | ₹100.2 | 2.7% 2 BHK ₹95,200/mo |
| Andheri West Established mid-market | ₹26,690 | ₹16,740 | +59.4% (-4.4% vs city line) | ₹68.9 | 3.1% 2 BHK ₹65,500/mo |
| Goregaon – Malad Growth suburb | ₹19,470 | ₹12,570 | +54.9% (-5.3% vs city line) | ₹55.2 | 3.4% 2 BHK ₹52,400/mo |
| Kandivali – Borivali Growth suburb | ₹18,330 | ₹11,930 | +53.6% (-5.7% vs city line) | ₹51.9 | 3.4% 2 BHK ₹49,300/mo |
| Central Suburbs · 5 | |||||
| Chembur Established mid-market | ₹24,350 | ₹14,880 | +63.6% (-1.1% vs city line) | ₹62.9 | 3.1% 2 BHK ₹59,800/mo |
| Powai Established mid-market | ₹24,000 | ₹14,880 | +61.3% (-2.6% vs city line) | ₹62 | 3.1% 2 BHK ₹58,900/mo |
| Ghatkopar – Vikhroli Established mid-market | ₹20,850 | ₹13,020 | +60.1% (-2.4% vs city line) | ₹53.9 | 3.1% 2 BHK ₹51,200/mo |
| Mulund Growth suburb | ₹18,350 | ₹11,930 | +53.8% (-5.6% vs city line) | ₹52 | 3.4% 2 BHK ₹49,400/mo |
| Bhandup – Kanjurmarg Growth suburb | ₹17,340 | ₹11,280 | +53.7% (-5.2% vs city line) | ₹49.1 | 3.4% 2 BHK ₹46,600/mo |
| Thane · 7 | |||||
| Thane – Pokhran Rd – Vasant Vihar Prime residential | ₹19,480 | ₹11,360 | +71.5% (+5.7% vs city line) | ₹43.8 | 2.7% 2 BHK ₹41,600/mo |
| Thane – Majiwada – Kolshet Established mid-market | ₹17,560 | ₹10,850 | +61.8% (+0.2% vs city line) | ₹45.4 | 3.1% 2 BHK ₹43,100/mo |
| Thane – Hiranandani Estate – Patlipada Established mid-market | ₹16,580 | ₹10,230 | +62.1% (+0.9% vs city line) | ₹42.8 | 3.1% 2 BHK ₹40,700/mo |
| Thane West Growth suburb | ₹15,400 | ₹9,990 | +54.2% (-3.8% vs city line) | ₹43.6 | 3.4% 2 BHK ₹41,400/mo |
| Thane – Ghodbunder Rd – Kasarvadavali Growth suburb | ₹13,610 | ₹8,700 | +56.4% (-1% vs city line) | ₹38.6 | 3.4% 2 BHK ₹36,700/mo |
| Kalwa – Mumbra – Diva Peripheral / emerging | ₹8,540 | ₹5,690 | +50.1% (+1.2% vs city line) | ₹26.3 | 3.7% 2 BHK ₹25,000/mo |
| Bhiwandi Peripheral / emerging | ₹5,540 | ₹3,680 | +50.5% (+13.1% vs city line) | ₹17.1 | 3.7% 2 BHK ₹16,200/mo |
| Navi Mumbai · 8 | |||||
| Navi Mumbai – Vashi Established mid-market | ₹18,670 | ₹11,470 | +62.8% (+0.3% vs city line) | ₹48.2 | 3.1% 2 BHK ₹45,800/mo |
| Navi Mumbai – Nerul – Seawoods Established mid-market | ₹16,630 | ₹10,230 | +62.6% (+1.2% vs city line) | ₹43 | 3.1% 2 BHK ₹40,800/mo |
| Navi Mumbai – Belapur CBD Established mid-market | ₹15,460 | ₹9,610 | +60.9% (+0.8% vs city line) | ₹39.9 | 3.1% 2 BHK ₹37,900/mo |
| Navi Mumbai – Airoli – Ghansoli Growth suburb | ₹13,590 | ₹8,700 | +56.2% (-1.1% vs city line) | ₹38.5 | 3.4% 2 BHK ₹36,600/mo |
| Navi Mumbai – Kharghar Peripheral / emerging | ₹11,610 | ₹7,700 | +50.8% (-3.1% vs city line) | ₹35.8 | 3.7% 2 BHK ₹34,000/mo |
| Navi Mumbai – Ulwe – Dronagiri Peripheral / emerging | ₹8,440 | ₹5,690 | +48.3% (0% vs city line) | ₹26 | 3.7% 2 BHK ₹24,700/mo |
| Panvel Peripheral / emerging | ₹7,730 | ₹5,220 | +48.1% (+1.6% vs city line) | ₹23.8 | 3.69% 2 BHK ₹22,600/mo |
| Navi Mumbai – Taloja Peripheral / emerging | ₹6,500 | ₹4,350 | +49.4% (+7% vs city line) | ₹20 | 3.69% 2 BHK ₹19,000/mo |
| Mira-Bhayandar & Vasai-Virar · 2 | |||||
| Dahisar – Mira Road – Bhayandar Peripheral / emerging | ₹11,010 | ₹7,370 | +49.4% (-3.4% vs city line) | ₹33.9 | 3.69% 2 BHK ₹32,200/mo |
| Vasai – Virar Peripheral / emerging | ₹7,550 | ₹5,020 | +50.4% (+4% vs city line) | ₹23.3 | 3.7% 2 BHK ₹22,100/mo |
| KDMC · 6 | |||||
| Dombivli East Growth suburb | ₹9,740 | ₹6,320 | +54.1% (+2% vs city line) | ₹27.6 | 3.4% 2 BHK ₹26,200/mo |
| Kalyan West Growth suburb | ₹9,530 | ₹6,130 | +55.5% (+3.4% vs city line) | ₹27 | 3.4% 2 BHK ₹25,600/mo |
| Kalyan East Peripheral / emerging | ₹7,190 | ₹4,820 | +49.2% (+4.1% vs city line) | ₹22.2 | 3.71% 2 BHK ₹21,100/mo |
| Ulhasnagar Peripheral / emerging | ₹6,850 | ₹4,550 | +50.5% (+6.5% vs city line) | ₹21.1 | 3.7% 2 BHK ₹20,000/mo |
| Ambernath – Badlapur Peripheral / emerging | ₹5,810 | ₹3,880 | +49.7% (+10.7% vs city line) | ₹17.9 | 3.7% 2 BHK ₹17,000/mo |
| Titwala – Ambivli Peripheral / emerging | ₹5,250 | ₹3,480 | +50.9% (+15.5% vs city line) | ₹16.2 | 3.7% 2 BHK ₹15,400/mo |
| Raigad & Weekend Homes · 5 | |||||
| Lonavala – Khandala Peripheral / emerging | ₹9,600 | ₹6,360 | +50.9% (-0.2% vs city line) | ₹29.6 | 3.7% 2 BHK ₹28,100/mo |
| Alibaug – Mandwa Peripheral / emerging | ₹8,430 | ₹5,690 | +48.2% (-0.1% vs city line) | ₹26 | 3.7% 2 BHK ₹24,700/mo |
| Uran – JNPT Peripheral / emerging | ₹5,950 | ₹4,020 | +48% (+8.3% vs city line) | ₹18.3 | 3.69% 2 BHK ₹17,400/mo |
| Khopoli – Pen Peripheral / emerging | ₹4,470 | ₹3,010 | +48.5% (+20.3% vs city line) | ₹13.8 | 3.7% 2 BHK ₹13,100/mo |
| Karjat – Neral Peripheral / emerging | ₹4,240 | ₹2,810 | +50.9% (+26% vs city line) | ₹13.1 | 3.71% 2 BHK ₹12,400/mo |
Land cost calculator — acquisition, stamp duty & TDR
Type a plot size; we apply the micro-market land rate, the state's stamp-duty rule (charged on the higher of market and reckoner value) and the local TDR pricing convention.
Acquisition (market)
₹16.64 cr
₹3,820/sq ft × 43,560 sq ft
Stamp duty + registration
₹1.00 cr
6% + 1% on ₹16.64 cr
Total outlay
₹17.64 cr
₹2,025 per buildable sq ft @ FSI 2
Maharashtra: 5% stamp + 1% metro cess (Mumbai/Pune/Nagpur) + 1% registration (cap ₹30k). TDR trades ≈ 30–40% of receiving-plot land reckoner. Indicative — confirm with the sub-registrar's current schedule.
Vidura market brief
Across MMR, transacted residential values run 48–84% above IGR Maharashtra's Ready Reckoner rates, with the annual RR revision still trailing a market appreciating near 6.5% YoY. The widest gaps sit in BKC (84.2%), Thane's Pokhran Road belt (71.5%) and the Malabar Hill–Cuffe Parade corridor (73.0%), reflecting scarcity of fresh supply, commercial-residential convergence and infrastructure-linked repricing (Metro, coastal road, redevelopment) that outpaces reckoner updates. Peripheral nodes like Panvel, Uran-JNPT and Karjat-Neral hold near-48% premiums, the market's floor, signalling these as relatively efficient entry points for land banking ahead of MTHL, Navi Mumbai Airport and freight corridor spillovers. For PPP and infrastructure investors, this reckoner-market gap is critical: acquisition costs (stamp duty, TDR, compensation) are reckoner-anchored and understate true asset value, while monetisation and exit pricing follow market rates—widening the underwriting margin but also litigation and holding-cost risk in high-premium micro-markets. With 1,000-plus redevelopment projects underway, expect the RR-market gap to persist, favoring investors who can arbitrage acquisition-versus-exit valuation gaps.
Generated 2026-09-26 from the engine's current numbers and recent headlines · refreshed weekly
5-year trend — city average, residential
Lime = engine's city average sale · sky = rent ₹/sq ft/month · dashed blue = YoY % · amber dots = credible prints (CRE Matrix / PropEquity / Knight Frank / IGR headlines, team deals) — 1 so far · 5Y sale +18.7% · rent +18.7%
- rent
- value
- yoy
Reckoner ↔ market correlation
market ≈ −₹1,586.7 + 1.7618 × reckoner · R² 0.997 · n = 43 micro-markets
Points above the line are micro-markets where the market has run further ahead of the government rate — expect higher land-acquisition cost and stamp-duty arbitrage; points below signal reckoner catch-up risk.
Recent public signals
Indicative desk estimates calibrated to government reckoner/circle rates and public signals; not a valuation. Refined daily and by team corrections. Reckoner source: IGR Maharashtra — Annual Statement of Rates (Ready Reckoner). Unit: ₹ per sq ft carpet (land: ₹ per sq ft of plot).