
Kolkata rates, per sq ft carpet.
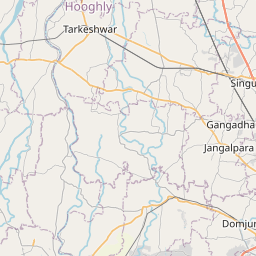
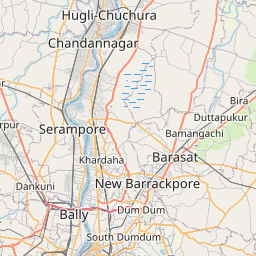
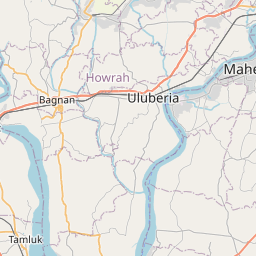
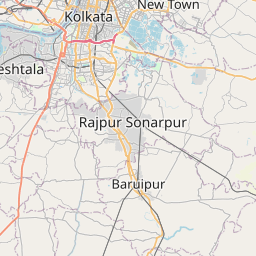
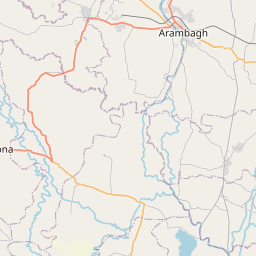
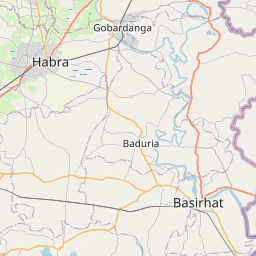
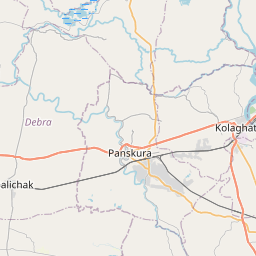
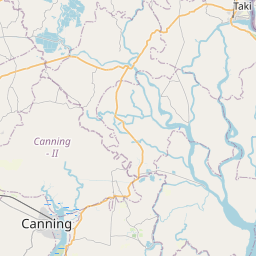
Pin = market rate, ₹/sq ft carpet. Click a pin to load it into the land-cost calculator.
| Micro-market | Market ₹/sq ft | Reckoner | Premium | Rent ₹/sq ft/mo | Yield · typical |
|---|---|---|---|---|---|
| Central & South · 3 | |||||
| Park Street – Alipore Central business district | ₹17,560 | ₹11,550 | +52% (+3.6% vs city line) | ₹35.1 | 2.4% 2 BHK ₹33,300/mo |
| Ballygunge Prime residential | ₹14,460 | ₹10,220 | +41.5% (-2.4% vs city line) | ₹32.5 | 2.7% 2 BHK ₹30,900/mo |
| Tollygunge – Jadavpur Established mid-market | ₹8,190 | ₹6,150 | +33.2% (-1.7% vs city line) | ₹21.2 | 3.11% 2 BHK ₹20,100/mo |
| East · 4 | |||||
| EM Bypass Established mid-market | ₹9,450 | ₹7,120 | +32.7% (-4.3% vs city line) | ₹24.4 | 3.1% 2 BHK ₹23,200/mo |
| Salt Lake – Sector V Established mid-market | ₹8,580 | ₹6,380 | +34.5% (-1.4% vs city line) | ₹22.2 | 3.1% 2 BHK ₹21,100/mo |
| New Town – Rajarhat Growth suburb | ₹6,860 | ₹5,300 | +29.4% (-1.7% vs city line) | ₹19.4 | 3.39% 2 BHK ₹18,400/mo |
| Rajarhat – Chinar Park Growth suburb | ₹6,270 | ₹4,840 | +29.5% (+0.4% vs city line) | ₹17.8 | 3.41% 2 BHK ₹16,900/mo |
| South · 2 | |||||
| Garia – Narendrapur Growth suburb | ₹5,770 | ₹4,520 | +27.7% (+0.7% vs city line) | ₹16.3 | 3.39% 2 BHK ₹15,500/mo |
| Sonarpur – Baruipur Peripheral / emerging | ₹3,760 | ₹3,080 | +22.1% (+9.4% vs city line) | ₹11.6 | 3.7% 2 BHK ₹11,000/mo |
| West · 1 | |||||
| Howrah – Behala Peripheral / emerging | ₹4,740 | ₹3,890 | +21.9% (+0.3% vs city line) | ₹14.6 | 3.7% 2 BHK ₹13,900/mo |
| North · 1 | |||||
| Dum Dum – Madhyamgram – Barasat Peripheral / emerging | ₹4,350 | ₹3,560 | +22.2% (+3.5% vs city line) | ₹13.4 | 3.7% 2 BHK ₹12,700/mo |
Land cost calculator — acquisition, stamp duty & TDR
Type a plot size; we apply the micro-market land rate, the state's stamp-duty rule (charged on the higher of market and reckoner value) and the local TDR pricing convention.
Acquisition (market)
₹101.45 cr
₹23,290/sq ft × 43,560 sq ft
Stamp duty + registration
₹7.10 cr
6% + 1% on ₹101.45 cr
Total outlay
₹108.55 cr
₹12,460 per buildable sq ft @ FSI 2
West Bengal: 6% (7% above ₹1 cr in urban areas) + 1% registration. Indicative — confirm with the sub-registrar's current schedule.
Vidura market brief
Kolkata's residential market trades well above WB Registration reckoner values across all tracked micro-markets, with premiums ranging from roughly 22% to 52%, underscoring that circle rates remain a conservative floor rather than a market proxy. Park Street–Alipore commands the steepest premium (52%, ₹17,560/sq ft vs ₹11,550 reckoner), followed by Ballygunge (41.5%), reflecting scarcity of central, well-connected inventory. This gap matters directly for PPP and infrastructure players: land acquisition costs benchmarked to reckoner rates will understate actual compensation or opportunity cost in core wards, while asset monetisation via TDR, stamp duty or lease premiums should reference market values to avoid revenue leakage. Peripheral growth corridors — New Town–Rajarhat, Chinar Park, Garia–Narendrapur — show tighter premiums (27–30%), signalling more efficient price discovery and better viability for large-format PPP housing or transit-oriented projects, especially with WB Housing Board's planned 3,500-unit rollout. With reckoner rates due for revision in 2026 and an underlying ~4% YoY appreciation trend, early-mover land banking in eastern and southern growth corridors ahead of the reset looks increasingly attractive.
Generated 2026-09-26 from the engine's current numbers and recent headlines · refreshed weekly
5-year trend — city average, residential
Lime = engine's city average sale · sky = rent ₹/sq ft/month · dashed blue = YoY % · amber dots = credible prints (CRE Matrix / PropEquity / Knight Frank / IGR headlines, team deals) — 0 so far · 5Y sale +11.6% · rent +11.8%
- rent
- value
- yoy
Reckoner ↔ market correlation
market ≈ −₹1,476.4 + 1.5948 × reckoner · R² 0.995 · n = 11 micro-markets
Points above the line are micro-markets where the market has run further ahead of the government rate — expect higher land-acquisition cost and stamp-duty arbitrage; points below signal reckoner catch-up risk.
Recent public signals
Indicative desk estimates calibrated to government reckoner/circle rates and public signals; not a valuation. Refined daily and by team corrections. Reckoner source: WB Registration — Market Value. Unit: ₹ per sq ft carpet (land: ₹ per sq ft of plot).