
Jaipur rates, per sq ft carpet.
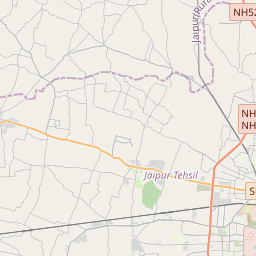
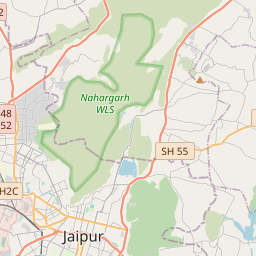
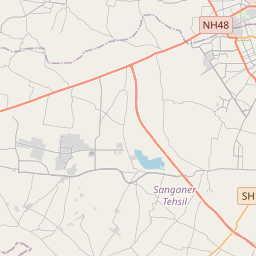
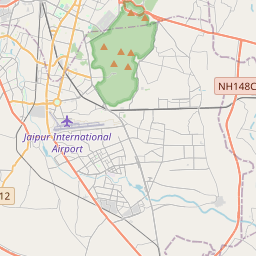
Pin = market rate, ₹/sq ft carpet. Click a pin to load it into the land-cost calculator.
| Micro-market | Market ₹/sq ft | Reckoner | Premium | Rent ₹/sq ft/mo | Yield · typical |
|---|---|---|---|---|---|
| C-Scheme – Civil Lines Central business district | ₹11,420 | ₹8,100 | +41% (+1.7% vs city line) | ₹22.8 | 2.4% 2 BHK ₹21,700/mo |
| Vaishali Nagar Prime residential | ₹7,820 | ₹5,870 | +33.2% (+1.2% vs city line) | ₹17.6 | 2.7% 2 BHK ₹16,700/mo |
| Malviya Nagar Established mid-market | ₹7,240 | ₹5,760 | +25.7% (-4.1% vs city line) | ₹18.7 | 3.1% 2 BHK ₹17,800/mo |
| Mansarovar Growth suburb | ₹5,650 | ₹4,660 | +21.2% (-3% vs city line) | ₹16 | 3.4% 2 BHK ₹15,200/mo |
| Tonk Rd – Jagatpura Growth suburb | ₹5,180 | ₹4,330 | +19.6% (-2.4% vs city line) | ₹14.7 | 3.41% 2 BHK ₹14,000/mo |
| Sirsi Rd – Vaishali Ext Peripheral / emerging | ₹4,170 | ₹3,630 | +14.9% (-0.9% vs city line) | ₹12.9 | 3.71% 2 BHK ₹12,300/mo |
| Ajmer Rd – Vatika Peripheral / emerging | ₹3,790 | ₹3,280 | +15.5% (+3.6% vs city line) | ₹11.7 | 3.7% 2 BHK ₹11,100/mo |
| Jhotwara – Kalwar Rd Peripheral / emerging | ₹3,610 | ₹3,110 | +16.1% (+6.5% vs city line) | ₹11.1 | 3.69% 2 BHK ₹10,500/mo |
Land cost calculator — acquisition, stamp duty & TDR
Type a plot size; we apply the micro-market land rate, the state's stamp-duty rule (charged on the higher of market and reckoner value) and the local TDR pricing convention.
Acquisition (market)
₹7.41 cr
₹1,700/sq ft × 43,560 sq ft
Stamp duty + registration
₹51.8 lakh
6% + 1% on ₹7.41 cr
Total outlay
₹7.92 cr
₹910 per buildable sq ft @ FSI 2
Rajasthan: 6% (5% women) + 1% registration + 30% surcharge on duty. Indicative — confirm with the sub-registrar's current schedule.
Vidura market brief
Jaipur's residential market trades consistently above e-Panjiyan DLC rates across all tracked micro-markets, with premiums narrowing from the core outward — a pattern reflecting genuine demand-supply gaps rather than speculative froth. C-Scheme–Civil Lines commands the steepest premium at 41.0% (₹11,420 vs ₹8,100/sq ft), followed by Vaishali Nagar at 33.2% and Malviya Nagar at 25.7%, underscoring how legacy central and inner-ring locations retain disproportionate pricing power despite DLC revisions. Peripheral corridors — Sirsi Road, Ajmer Road-Vatika, and Jhotwara — hold tighter premiums of 15-16%, signalling closer alignment between reckoner and market value and, consequently, more predictable land acquisition costs for PPP and infrastructure projects. For asset monetisation and viability gap calculations, this spread matters directly: high-premium zones inflate compensation and betterment-levy assumptions if DLC-linked benchmarks are used uncritically, while peripheral corridors offer cleaner arbitrage for land pooling and TOD-linked development. With citywide appreciation tracking near 7% YoY and tier-2 markets nationally outpacing metros, Jaipur's outer corridors are positioned to re-rate first as connectivity investments mature.
Generated 2026-09-26 from the engine's current numbers and recent headlines · refreshed weekly
5-year trend — city average, residential
Lime = engine's city average sale · sky = rent ₹/sq ft/month · dashed blue = YoY % · amber dots = credible prints (CRE Matrix / PropEquity / Knight Frank / IGR headlines, team deals) — 0 so far · 5Y sale +20% · rent +19.8%
- rent
- value
- yoy
Reckoner ↔ market correlation
market ≈ −₹1,493.5 + 1.5702 × reckoner · R² 0.995 · n = 8 micro-markets
Points above the line are micro-markets where the market has run further ahead of the government rate — expect higher land-acquisition cost and stamp-duty arbitrage; points below signal reckoner catch-up risk.
Recent public signals
Indicative desk estimates calibrated to government reckoner/circle rates and public signals; not a valuation. Refined daily and by team corrections. Reckoner source: e-Panjiyan — DLC Rates. Unit: ₹ per sq ft carpet (land: ₹ per sq ft of plot).