
Hyderabad rates, per sq ft carpet.
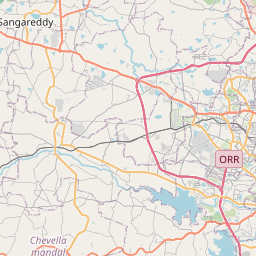
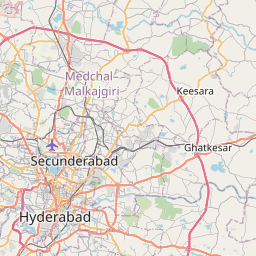
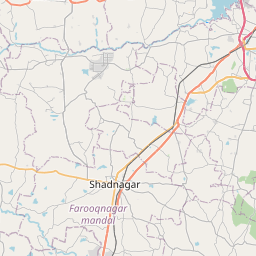
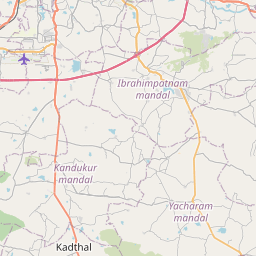
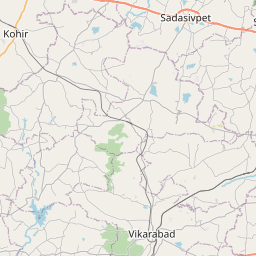
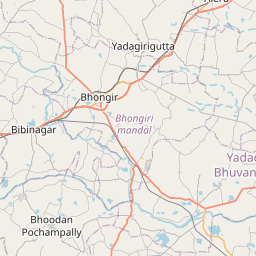

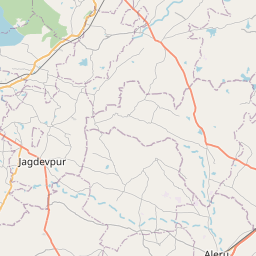

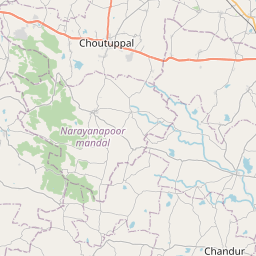
Pin = market rate, ₹/sq ft carpet. Click a pin to load it into the land-cost calculator.
| Micro-market | Market ₹/sq ft | Reckoner | Premium | Rent ₹/sq ft/mo | Yield · typical |
|---|---|---|---|---|---|
| Core City · 2 | |||||
| Banjara Hills – Jubilee Hills Prime residential | ₹16,660 | ₹9,310 | +78.9% (+0.2% vs city line) | ₹37.5 | 2.7% 2 BHK ₹35,600/mo |
| Begumpet – Somajiguda Prime residential | ₹12,470 | ₹7,050 | +76.9% (+1.8% vs city line) | ₹28.1 | 2.7% 2 BHK ₹26,700/mo |
| West · 6 | |||||
| HITEC City – Madhapur Central business district | ₹13,440 | ₹7,130 | +88.5% (+8.4% vs city line) | ₹26.9 | 2.4% 2 BHK ₹25,600/mo |
| Kokapet – Narsingi Established mid-market | ₹11,960 | ₹7,200 | +66.1% (-4.6% vs city line) | ₹30.9 | 3.1% 2 BHK ₹29,400/mo |
| Gachibowli – Financial District Established mid-market | ₹11,430 | ₹6,900 | +65.7% (-4.4% vs city line) | ₹29.5 | 3.1% 2 BHK ₹28,000/mo |
| Manikonda – Puppalaguda Established mid-market | ₹9,170 | ₹5,520 | +66.1% (-1.3% vs city line) | ₹23.7 | 3.1% 2 BHK ₹22,500/mo |
| Kondapur – Miyapur Growth suburb | ₹8,260 | ₹5,120 | +61.3% (-3% vs city line) | ₹23.4 | 3.4% 2 BHK ₹22,200/mo |
| Mokila – Shankarpalli Peripheral / emerging | ₹5,250 | ₹3,370 | +55.8% (+2.4% vs city line) | ₹16.2 | 3.7% 2 BHK ₹15,400/mo |
| South · 2 | |||||
| Attapur – Rajendranagar Growth suburb | ₹7,230 | ₹4,490 | +61% (-0.9% vs city line) | ₹20.5 | 3.4% 2 BHK ₹19,500/mo |
| Shamshabad – Tellapur Peripheral / emerging | ₹5,860 | ₹3,760 | +55.9% (-0.3% vs city line) | ₹18.1 | 3.71% 2 BHK ₹17,200/mo |
| North · 2 | |||||
| Bachupally – Nizampet Growth suburb | ₹6,720 | ₹4,240 | +58.5% (-1.3% vs city line) | ₹19 | 3.39% 2 BHK ₹18,000/mo |
| Kompally – Medchal Peripheral / emerging | ₹5,560 | ₹3,560 | +56.2% (+1.2% vs city line) | ₹17.1 | 3.69% 2 BHK ₹16,200/mo |
| East · 2 | |||||
| Uppal – LB Nagar Growth suburb | ₹6,460 | ₹4,060 | +59.1% (0% vs city line) | ₹18.3 | 3.4% 2 BHK ₹17,400/mo |
| Pocharam – Ghatkesar Peripheral / emerging | ₹4,780 | ₹3,110 | +53.7% (+3.4% vs city line) | ₹14.7 | 3.69% 2 BHK ₹14,000/mo |
Land cost calculator — acquisition, stamp duty & TDR
Type a plot size; we apply the micro-market land rate, the state's stamp-duty rule (charged on the higher of market and reckoner value) and the local TDR pricing convention.
Acquisition (market)
₹22.04 cr
₹5,060/sq ft × 43,560 sq ft
Stamp duty + registration
₹1.32 cr
5.5% + 0.5% on ₹22.04 cr
Total outlay
₹23.36 cr
₹2,682 per buildable sq ft @ FSI 2
Telangana: 4% stamp + 1.5% transfer duty + 0.5% registration. TDR under GHMC road-widening. Indicative — confirm with the sub-registrar's current schedule.
Vidura market brief
Hyderabad's residential market continues to trade well above IGRS Telangana reckoner values across all tracked micro-markets, with citywide premiums ranging 54-89% and a seeded YoY appreciation near 8.5%. HITEC City–Madhapur commands the steepest premium at 88.5% (₹13,440 vs ₹7,130 reckoner), followed by Banjara Hills–Jubilee Hills at 78.9%, reflecting sustained GCC-driven office demand — Hyderabad is projected to add 12 million sq ft of office space and outpace Bengaluru in GCC additions. This wide market-reckoner gap in core IT corridors inflates land acquisition costs for PPP projects and complicates asset monetisation, since reckoner-based valuations understate true acquisition liabilities. Peripheral corridors like Kokapet–Narsingi and Gachibowli–Financial District, with premiums near 65-66%, offer relatively better cost-value alignment for infrastructure staging. Notably, despite home sales falling to a 4.5-year low and rising unsold inventory, prices show no correction — signalling sticky valuations that PPP planners must price in regardless of near-term demand softness. Expect premiums to persist as GCC expansion anchors long-term demand.
Generated 2026-09-26 from the engine's current numbers and recent headlines · refreshed weekly
5-year trend — city average, residential
Lime = engine's city average sale · sky = rent ₹/sq ft/month · dashed blue = YoY % · amber dots = credible prints (CRE Matrix / PropEquity / Knight Frank / IGR headlines, team deals) — 0 so far · 5Y sale +25% · rent +24.9%
- rent
- value
- yoy
Reckoner ↔ market correlation
market ≈ −₹1,396.3 + 1.9353 × reckoner · R² 0.989 · n = 14 micro-markets
Points above the line are micro-markets where the market has run further ahead of the government rate — expect higher land-acquisition cost and stamp-duty arbitrage; points below signal reckoner catch-up risk.
Recent public signals
Indicative desk estimates calibrated to government reckoner/circle rates and public signals; not a valuation. Refined daily and by team corrections. Reckoner source: IGRS Telangana — Market Value. Unit: ₹ per sq ft carpet (land: ₹ per sq ft of plot).