
Delhi NCR rates, per sq ft carpet.
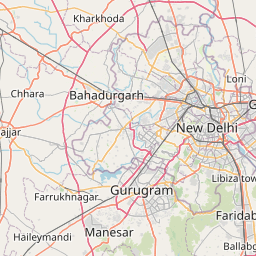
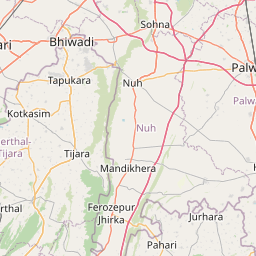
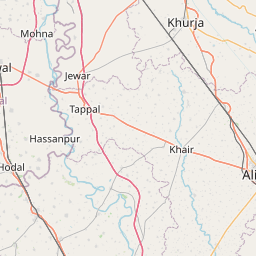
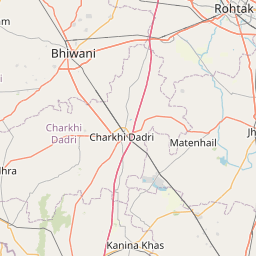
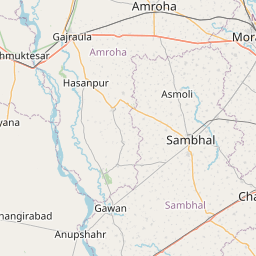
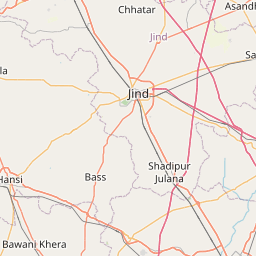
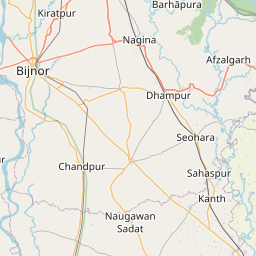
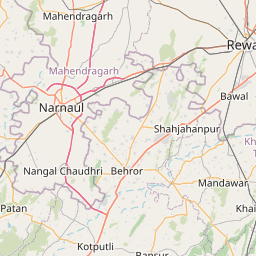
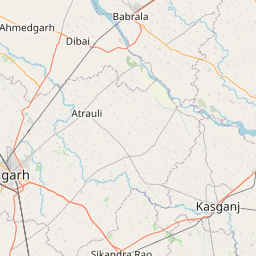
Pin = market rate, ₹/sq ft carpet. Click a pin to load it into the land-cost calculator.
| Micro-market | Market ₹/sq ft | Reckoner | Premium | Rent ₹/sq ft/mo | Yield · typical |
|---|---|---|---|---|---|
| Delhi · 5 | |||||
| Connaught Place – Lutyens Central business district | ₹54,620 | ₹28,070 | +94.6% (+1.5% vs city line) | ₹109.2 | 2.4% 2 BHK ₹1,03,700/mo |
| South Delhi – Vasant Vihar / GK Prime residential | ₹31,840 | ₹17,450 | +82.5% (-4.6% vs city line) | ₹71.6 | 2.7% 2 BHK ₹68,000/mo |
| Rohini – Pitampura Established mid-market | ₹14,440 | ₹8,410 | +71.7% (-9.7% vs city line) | ₹37.3 | 3.1% 2 BHK ₹35,400/mo |
| East Delhi – Mayur Vihar – Preet Vihar Established mid-market | ₹13,550 | ₹7,830 | +73.1% (-8.9% vs city line) | ₹35 | 3.1% 2 BHK ₹33,200/mo |
| Dwarka Established mid-market | ₹12,400 | ₹7,250 | +71% (-9.9% vs city line) | ₹32 | 3.1% 2 BHK ₹30,400/mo |
| Noida & Greater Noida · 5 | |||||
| Noida – Central (Sec 50/75/78) Established mid-market | ₹27,780 | ₹7,250 | +283.2% (+101.9% vs city line) | ₹71.8 | 3.1% 2 BHK ₹68,200/mo |
| Noida Expressway (Sec 128–137) Established mid-market | ₹13,430 | ₹7,830 | +71.5% (-9.7% vs city line) | ₹34.7 | 3.1% 2 BHK ₹33,000/mo |
| Noida – Sector 150 Growth suburb | ₹11,120 | ₹6,640 | +67.5% (-11.6% vs city line) | ₹31.5 | 3.4% 2 BHK ₹29,900/mo |
| Greater Noida West Peripheral / emerging | ₹7,250 | ₹4,510 | +60.8% (-14.6% vs city line) | ₹22.4 | 3.71% 2 BHK ₹21,300/mo |
| Yamuna Expressway – Jewar Peripheral / emerging | ₹5,210 | ₹3,260 | +59.8% (-14.3% vs city line) | ₹16.1 | 3.71% 2 BHK ₹15,300/mo |
| Gurugram · 6 | |||||
| Gurugram – DLF Phase 1–5 Prime residential | ₹25,950 | ₹14,180 | +83% (-4.2% vs city line) | ₹58.4 | 2.7% 2 BHK ₹55,500/mo |
| Gurugram – Golf Course Rd Prime residential | ₹23,790 | ₹13,080 | +81.9% (-4.8% vs city line) | ₹53.5 | 2.7% 2 BHK ₹50,800/mo |
| Gurugram – Sohna Rd – SPR Growth suburb | ₹13,420 | ₹8,140 | +64.9% (-13.3% vs city line) | ₹38 | 3.4% 2 BHK ₹36,100/mo |
| Gurugram – Dwarka Expressway Growth suburb | ₹12,580 | ₹7,540 | +66.8% (-12.1% vs city line) | ₹35.6 | 3.4% 2 BHK ₹33,800/mo |
| Gurugram – New Gurugram (Sec 80–95) Growth suburb | ₹10,490 | ₹6,330 | +65.7% (-12.5% vs city line) | ₹29.7 | 3.4% 2 BHK ₹28,200/mo |
| Sohna – Manesar Peripheral / emerging | ₹6,180 | ₹3,880 | +59.3% (-15% vs city line) | ₹19.1 | 3.71% 2 BHK ₹18,100/mo |
| Ghaziabad & Faridabad · 2 | |||||
| Ghaziabad – Indirapuram – Raj Nagar Ext Peripheral / emerging | ₹6,960 | ₹4,380 | +58.9% (-15.5% vs city line) | ₹21.5 | 3.71% 2 BHK ₹20,400/mo |
| Faridabad Peripheral / emerging | ₹6,580 | ₹4,070 | +61.7% (-13.8% vs city line) | ₹20.3 | 3.7% 2 BHK ₹19,300/mo |
Land cost calculator — acquisition, stamp duty & TDR
Type a plot size; we apply the micro-market land rate, the state's stamp-duty rule (charged on the higher of market and reckoner value) and the local TDR pricing convention.
Acquisition (market)
₹524.16 cr
₹1,20,330/sq ft × 43,560 sq ft
Stamp duty + registration
₹36.69 cr
6% + 1% on ₹524.16 cr
Total outlay
₹560.85 cr
₹64,377 per buildable sq ft @ FSI 2
Delhi: 6% (men) / 4% (women) + 1% registration. No formal TDR market. Indicative — confirm with the sub-registrar's current schedule.
Vidura market brief
Delhi NCR's residential market trades well above Delhi Revenue Department circle rates across every micro-market tracked, with citywide values compounding at roughly 8% YoY. The widest gap sits in Noida's central corridor (Sectors 50/75/78), where market rates of ₹27,780/sq ft carpet run 283% above the ₹7,250 reckoner — a divergence reflecting years of stale circle-rate revisions relative to genuine end-user and investor demand. Lutyens' Connaught Place (94.6% premium) and Vasant Vihar/GK (82.5%) round out the core-Delhi outliers, while Gurugram's DLF Phase 1-5 and Golf Course Road cluster near 82-83%. For PPP sponsors and land-assembly teams, this circle-rate lag matters directly: acquisition cost benchmarks anchored to reckoner values will understate real compensation and stamp-duty liabilities, and asset-monetisation models (annuity, TOD, land-value-capture) risk mispricing viability gaps if underwritten off outdated government rates rather than transacted values. Expect periodic reckoner revisions in high-premium zones like Noida-Central to narrow this gap and reset acquisition economics going forward.
Generated 2026-09-06 from the engine's current numbers and recent headlines · refreshed weekly
5-year trend — city average, residential
Lime = engine's city average sale · sky = rent ₹/sq ft/month · dashed blue = YoY % · amber dots = credible prints (CRE Matrix / PropEquity / Knight Frank / IGR headlines, team deals) — 1 so far · 5Y sale +23.2% · rent +23.2%
- rent
- value
- yoy
Reckoner ↔ market correlation
market ≈ −₹194.9 + 1.9245 × reckoner · R² 0.877 · n = 18 micro-markets
Points above the line are micro-markets where the market has run further ahead of the government rate — expect higher land-acquisition cost and stamp-duty arbitrage; points below signal reckoner catch-up risk.
Recent public signals
Indicative desk estimates calibrated to government reckoner/circle rates and public signals; not a valuation. Refined daily and by team corrections. Reckoner source: Delhi Revenue Dept — Circle Rates. Unit: ₹ per sq ft carpet (land: ₹ per sq ft of plot).