
Chennai rates, per sq ft carpet.
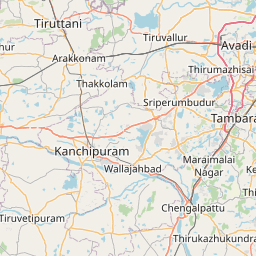



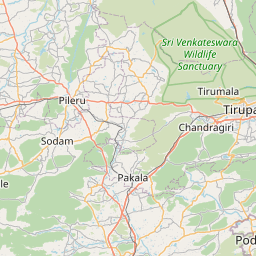



Pin = market rate, ₹/sq ft carpet. Click a pin to load it into the land-cost calculator.
| Micro-market | Market ₹/sq ft | Reckoner | Premium | Rent ₹/sq ft/mo | Yield · typical |
|---|---|---|---|---|---|
| Core City · 3 | |||||
| Boat Club – Nungambakkam Central business district | ₹25,930 | ₹14,870 | +74.4% (+3.3% vs city line) | ₹51.9 | 2.4% 2 BHK ₹49,300/mo |
| Kilpauk – Egmore Prime residential | ₹17,400 | ₹10,690 | +62.8% (-1.2% vs city line) | ₹39.1 | 2.7% 2 BHK ₹37,100/mo |
| Anna Nagar Established mid-market | ₹14,660 | ₹9,420 | +55.6% (-4.4% vs city line) | ₹37.9 | 3.1% 2 BHK ₹36,000/mo |
| South · 5 | |||||
| Adyar – Besant Nagar Prime residential | ₹18,380 | ₹11,300 | +62.7% (-1.7% vs city line) | ₹41.4 | 2.7% 2 BHK ₹39,300/mo |
| ECR – Neelankarai – Injambakkam Established mid-market | ₹11,470 | ₹7,480 | +53.3% (-3.3% vs city line) | ₹29.6 | 3.1% 2 BHK ₹28,100/mo |
| Velachery – Pallikaranai Established mid-market | ₹9,490 | ₹6,180 | +53.6% (-0.5% vs city line) | ₹24.5 | 3.1% 2 BHK ₹23,300/mo |
| Medavakkam – Sithalapakkam Growth suburb | ₹6,810 | ₹4,600 | +48% (+1.6% vs city line) | ₹19.3 | 3.4% 2 BHK ₹18,300/mo |
| GST Rd – Tambaram / Guduvancheri Peripheral / emerging | ₹5,590 | ₹3,930 | +42.2% (+1.6% vs city line) | ₹17.2 | 3.69% 2 BHK ₹16,300/mo |
| OMR · 2 | |||||
| OMR – Perungudi / Sholinganallur Established mid-market | ₹8,510 | ₹5,520 | +54.2% (+1.9% vs city line) | ₹22 | 3.1% 2 BHK ₹20,900/mo |
| Thoraipakkam – Siruseri Growth suburb | ₹7,240 | ₹4,870 | +48.7% (+0.7% vs city line) | ₹20.5 | 3.4% 2 BHK ₹19,500/mo |
| West · 3 | |||||
| Porur – Poonamallee Growth suburb | ₹7,210 | ₹4,870 | +48% (+0.3% vs city line) | ₹20.4 | 3.4% 2 BHK ₹19,400/mo |
| Ambattur – Avadi Peripheral / emerging | ₹5,740 | ₹4,070 | +41% (-0.2% vs city line) | ₹17.7 | 3.7% 2 BHK ₹16,800/mo |
| Oragadam – Sriperumbudur Peripheral / emerging | ₹4,240 | ₹2,950 | +43.7% (+13.1% vs city line) | ₹13.1 | 3.71% 2 BHK ₹12,400/mo |
| Weekend Homes · 1 | |||||
| Mahabalipuram – ECR South Peripheral / emerging | ₹6,530 | ₹4,560 | +43.2% (-1.5% vs city line) | ₹20.1 | 3.69% 2 BHK ₹19,100/mo |
Land cost calculator — acquisition, stamp duty & TDR
Type a plot size; we apply the micro-market land rate, the state's stamp-duty rule (charged on the higher of market and reckoner value) and the local TDR pricing convention.
Acquisition (market)
₹128.20 cr
₹29,430/sq ft × 43,560 sq ft
Stamp duty + registration
₹14.10 cr
7% + 4% on ₹128.20 cr
Total outlay
₹142.30 cr
₹16,334 per buildable sq ft @ FSI 2
Tamil Nadu: 7% stamp + 4% registration (highest in India). TDR under TNCDBR 2019. Indicative — confirm with the sub-registrar's current schedule.
Vidura market brief
Chennai's residential market trades well above TNREGINET guideline values across every tracked micro-market, with premiums ranging from roughly 41% to 74%, underscoring how stale statutory benchmarks have become relative to transacted prices even in a market growing at a seeded ~6% YoY. The widest gaps sit in the core—Boat Club-Nungambakkam (74.4%), Adyar-Besant Nagar (62.7%) and Kilpauk-Egmore (62.8%)—where scarce inventory and heritage-zone constraints keep market values far ahead of official reckoners. This matters directly for land acquisition costs and compensation benchmarking under PPP frameworks, since guideline values understate true replacement cost, complicating fair-value negotiations and asset-monetisation exercises tied to statutory rates. Peripheral growth corridors—OMR, GST Road, Oragadam-Sriperumbudur—show comparatively tighter but still meaningful premiums (42-54%), reflecting steady IT-corridor and industrial-linked absorption rather than speculative excess. For infrastructure investors, this persistent guideline-market gap signals both undervalued land-bank potential near transit corridors and the need for updated circle rates before large-scale PPP land parcels are structured. Expect continued upward pressure on premiums as reckoner revisions lag actual demand.
Generated 2026-09-06 from the engine's current numbers and recent headlines · refreshed weekly
5-year trend — city average, residential
Lime = engine's city average sale · sky = rent ₹/sq ft/month · dashed blue = YoY % · amber dots = credible prints (CRE Matrix / PropEquity / Knight Frank / IGR headlines, team deals) — 0 so far · 5Y sale +17.3% · rent +17%
- rent
- value
- yoy
Reckoner ↔ market correlation
market ≈ −₹1,534.8 + 1.7909 × reckoner · R² 0.997 · n = 14 micro-markets
Points above the line are micro-markets where the market has run further ahead of the government rate — expect higher land-acquisition cost and stamp-duty arbitrage; points below signal reckoner catch-up risk.
Indicative desk estimates calibrated to government reckoner/circle rates and public signals; not a valuation. Refined daily and by team corrections. Reckoner source: TNREGINET — Guideline Value. Unit: ₹ per sq ft carpet (land: ₹ per sq ft of plot).