
Chennai rates, per sq ft carpet.
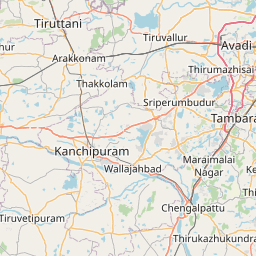
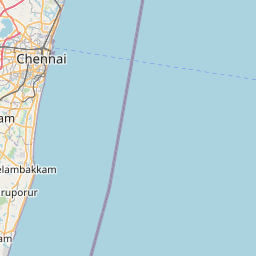
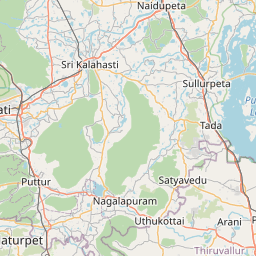



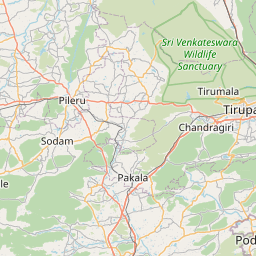



Pin = market rate, ₹/sq ft carpet. Click a pin to load it into the land-cost calculator.
| Micro-market | Market ₹/sq ft | Reckoner | Premium | Rent ₹/sq ft/mo | Yield · typical |
|---|---|---|---|---|---|
| Core City · 3 | |||||
| Boat Club – Nungambakkam Central business district | ₹25,930 | ₹14,870 | +74.4% (+3.3% vs city line) | ₹51.9 | 2.4% 2 BHK ₹49,300/mo |
| Kilpauk – Egmore Prime residential | ₹17,400 | ₹10,690 | +62.8% (-1.2% vs city line) | ₹39.1 | 2.7% 2 BHK ₹37,100/mo |
| Anna Nagar Established mid-market | ₹14,660 | ₹9,420 | +55.6% (-4.4% vs city line) | ₹37.9 | 3.1% 2 BHK ₹36,000/mo |
| South · 5 | |||||
| Adyar – Besant Nagar Prime residential | ₹18,380 | ₹11,300 | +62.7% (-1.7% vs city line) | ₹41.4 | 2.7% 2 BHK ₹39,300/mo |
| ECR – Neelankarai – Injambakkam Established mid-market | ₹11,470 | ₹7,480 | +53.3% (-3.3% vs city line) | ₹29.6 | 3.1% 2 BHK ₹28,100/mo |
| Velachery – Pallikaranai Established mid-market | ₹9,490 | ₹6,180 | +53.6% (-0.5% vs city line) | ₹24.5 | 3.1% 2 BHK ₹23,300/mo |
| Medavakkam – Sithalapakkam Growth suburb | ₹6,810 | ₹4,600 | +48% (+1.6% vs city line) | ₹19.3 | 3.4% 2 BHK ₹18,300/mo |
| GST Rd – Tambaram / Guduvancheri Peripheral / emerging | ₹5,590 | ₹3,930 | +42.2% (+1.6% vs city line) | ₹17.2 | 3.69% 2 BHK ₹16,300/mo |
| OMR · 2 | |||||
| OMR – Perungudi / Sholinganallur Established mid-market | ₹8,510 | ₹5,520 | +54.2% (+1.9% vs city line) | ₹22 | 3.1% 2 BHK ₹20,900/mo |
| Thoraipakkam – Siruseri Growth suburb | ₹7,240 | ₹4,870 | +48.7% (+0.7% vs city line) | ₹20.5 | 3.4% 2 BHK ₹19,500/mo |
| West · 3 | |||||
| Porur – Poonamallee Growth suburb | ₹7,210 | ₹4,870 | +48% (+0.3% vs city line) | ₹20.4 | 3.4% 2 BHK ₹19,400/mo |
| Ambattur – Avadi Peripheral / emerging | ₹5,740 | ₹4,070 | +41% (-0.2% vs city line) | ₹17.7 | 3.7% 2 BHK ₹16,800/mo |
| Oragadam – Sriperumbudur Peripheral / emerging | ₹4,240 | ₹2,950 | +43.7% (+13.1% vs city line) | ₹13.1 | 3.71% 2 BHK ₹12,400/mo |
| Weekend Homes · 1 | |||||
| Mahabalipuram – ECR South Peripheral / emerging | ₹6,530 | ₹4,560 | +43.2% (-1.5% vs city line) | ₹20.1 | 3.69% 2 BHK ₹19,100/mo |
Land cost calculator — acquisition, stamp duty & TDR
Type a plot size; we apply the micro-market land rate, the state's stamp-duty rule (charged on the higher of market and reckoner value) and the local TDR pricing convention.
Acquisition (market)
₹128.20 cr
₹29,430/sq ft × 43,560 sq ft
Stamp duty + registration
₹14.10 cr
7% + 4% on ₹128.20 cr
Total outlay
₹142.30 cr
₹16,334 per buildable sq ft @ FSI 2
Tamil Nadu: 7% stamp + 4% registration (highest in India). TDR under TNCDBR 2019. Indicative — confirm with the sub-registrar's current schedule.
Vidura market brief
Chennai's residential values continue to run well above TNREGINET guideline rates across every micro-market tracked, underscoring how far circle rates lag transacted prices even at an assumed ~6% YoY appreciation. The widest gaps sit in the legacy core — Boat Club-Nungambakkam (74.4%), Adyar-Besant Nagar (62.7%) and Kilpauk-Egmore (62.8%) — where scarce inventory and heritage-zone constraints keep premiums structurally high, making land acquisition here costly and better suited to redevelopment or TDR-based monetisation than fresh PPP assembly. Peripheral IT and industrial corridors — OMR, Thoraipakkam-Siruseri, Porur-Poonamallee, GST Road and Oragadam-Sriperumbudur — show steadier 42-54% premiums, offering more predictable land economics for infrastructure and PPP structuring, especially as the Pallavaram-Thoraipakkam corridor gains institutional traction, evidenced by KLA's ₹1,020 crore land buy signalling GCC and semiconductor-led demand. With five airport-adjacent cities across Tamil Nadu emerging as connectivity-driven hotspots, expect guideline-value revisions to progressively narrow the reckoner-market gap, particularly along growth corridors, sharpening the case for early-stage land banking ahead of formal rate catch-up.
Generated 2026-09-26 from the engine's current numbers and recent headlines · refreshed weekly
5-year trend — city average, residential
Lime = engine's city average sale · sky = rent ₹/sq ft/month · dashed blue = YoY % · amber dots = credible prints (CRE Matrix / PropEquity / Knight Frank / IGR headlines, team deals) — 0 so far · 5Y sale +17.3% · rent +17%
- rent
- value
- yoy
Reckoner ↔ market correlation
market ≈ −₹1,534.8 + 1.7909 × reckoner · R² 0.997 · n = 14 micro-markets
Points above the line are micro-markets where the market has run further ahead of the government rate — expect higher land-acquisition cost and stamp-duty arbitrage; points below signal reckoner catch-up risk.
Recent public signals
Indicative desk estimates calibrated to government reckoner/circle rates and public signals; not a valuation. Refined daily and by team corrections. Reckoner source: TNREGINET — Guideline Value. Unit: ₹ per sq ft carpet (land: ₹ per sq ft of plot).