
Bengaluru rates, per sq ft carpet.




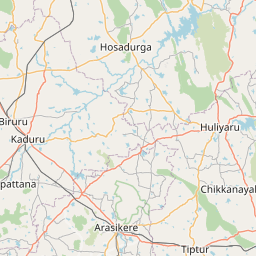
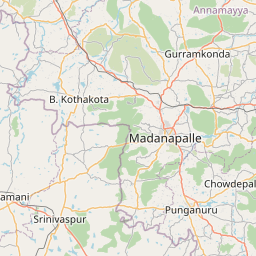
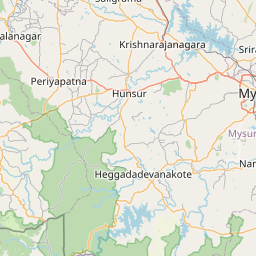

Pin = market rate, ₹/sq ft carpet. Click a pin to load it into the land-cost calculator.
| Micro-market | Market ₹/sq ft | Reckoner | Premium | Rent ₹/sq ft/mo | Yield · typical |
|---|---|---|---|---|---|
| Central · 3 | |||||
| CBD – MG Rd / Lavelle Rd Central business district | ₹28,110 | ₹13,550 | +107.5% (+2% vs city line) | ₹56.2 | 2.4% 2 BHK ₹53,400/mo |
| Indiranagar – Koramangala Prime residential | ₹18,640 | ₹9,560 | +95% (-1.3% vs city line) | ₹41.9 | 2.7% 2 BHK ₹39,800/mo |
| Rajajinagar – Malleshwaram Prime residential | ₹16,320 | ₹8,530 | +91.3% (-1.9% vs city line) | ₹36.7 | 2.7% 2 BHK ₹34,900/mo |
| South · 5 | |||||
| JP Nagar – Jayanagar Prime residential | ₹15,680 | ₹8,010 | +95.8% (+1.2% vs city line) | ₹35.3 | 2.7% 2 BHK ₹33,500/mo |
| Bannerghatta Rd Established mid-market | ₹9,130 | ₹5,060 | +80.4% (+0.6% vs city line) | ₹23.6 | 3.1% 2 BHK ₹22,400/mo |
| Kanakapura Rd Growth suburb | ₹8,210 | ₹4,690 | +75.1% (-0.7% vs city line) | ₹23.3 | 3.41% 2 BHK ₹22,100/mo |
| Electronic City Growth suburb | ₹7,220 | ₹4,120 | +75.2% (+2.8% vs city line) | ₹20.5 | 3.41% 2 BHK ₹19,500/mo |
| Hosur Rd – Attibele Peripheral / emerging | ₹5,460 | ₹3,270 | +67% (+5.6% vs city line) | ₹16.8 | 3.69% 2 BHK ₹16,000/mo |
| North · 3 | |||||
| Hebbal – North Bengaluru Established mid-market | ₹11,530 | ₹6,330 | +82.1% (-2.6% vs city line) | ₹29.8 | 3.1% 2 BHK ₹28,300/mo |
| Thanisandra – Hennur Established mid-market | ₹9,430 | ₹5,220 | +80.7% (+0.1% vs city line) | ₹24.4 | 3.1% 2 BHK ₹23,200/mo |
| Yelahanka – Devanahalli Peripheral / emerging | ₹6,170 | ₹3,680 | +67.7% (+1.7% vs city line) | ₹19 | 3.7% 2 BHK ₹18,000/mo |
| East · 5 | |||||
| Bellandur – Marathahalli Established mid-market | ₹11,380 | ₹6,330 | +79.8% (-3.9% vs city line) | ₹29.4 | 3.1% 2 BHK ₹27,900/mo |
| Whitefield Established mid-market | ₹10,400 | ₹5,780 | +79.9% (-2.3% vs city line) | ₹26.9 | 3.1% 2 BHK ₹25,600/mo |
| Sarjapur Rd Established mid-market | ₹9,710 | ₹5,390 | +80.1% (-0.8% vs city line) | ₹25.1 | 3.1% 2 BHK ₹23,800/mo |
| KR Puram – Old Madras Rd Growth suburb | ₹8,420 | ₹4,860 | +73.3% (-2.5% vs city line) | ₹23.9 | 3.41% 2 BHK ₹22,700/mo |
| Varthur – Gunjur Growth suburb | ₹8,050 | ₹4,580 | +75.8% (+0.3% vs city line) | ₹22.8 | 3.4% 2 BHK ₹21,700/mo |
| West · 2 | |||||
| Mysore Rd – Kengeri Peripheral / emerging | ₹6,490 | ₹3,860 | +68.1% (+0.5% vs city line) | ₹20 | 3.7% 2 BHK ₹19,000/mo |
| Tumkur Rd – Nelamangala Peripheral / emerging | ₹5,260 | ₹3,090 | +70.2% (+10.1% vs city line) | ₹16.2 | 3.7% 2 BHK ₹15,400/mo |
Land cost calculator — acquisition, stamp duty & TDR
Type a plot size; we apply the micro-market land rate, the state's stamp-duty rule (charged on the higher of market and reckoner value) and the local TDR pricing convention.
Acquisition (market)
₹39.68 cr
₹9,110/sq ft × 43,560 sq ft
Stamp duty + registration
₹2.62 cr
5.6% + 1% on ₹39.68 cr
Total outlay
₹42.30 cr
₹4,856 per buildable sq ft @ FSI 2
Karnataka: 5% + 10% cess & 2% surcharge on duty (≈5.6%) + 1% registration. TDR/DRC certificates actively traded in Bengaluru. Indicative — confirm with the sub-registrar's current schedule.
Vidura market brief
Bengaluru's residential market trades well above Kaveri Online guidance values across every micro-market, with premiums ranging from roughly 67% in outer corridors to over 107% in the CBD, against a seeded YoY appreciation near 9%. MG Rd/Lavelle Rd commands the steepest gap (₹28,110/sq ft vs ₹13,550 guidance), followed by Indiranagar-Koramangala and Jayanagar, reflecting scarcity of central land parcels and dense commercial-residential mixed use. For PPP and infrastructure investors, this reckoner-market divergence matters directly: land acquisition costs via government compensation formulas will understate true market value in core zones, complicating rehabilitation and resettlement budgeting, while asset monetisation (land banks, TOD parcels) in peripheral corridors like Yelahanka-Devanahalli, Electronic City, and Hosur Rd offers better reckoner alignment and cleaner viability gap funding math. Growth corridors near the airport and emerging IT hubs like Yeshwanthpur-Goraguntepalya show early price acceleration, signalling where infrastructure-led value capture could be most effective. Expect guidance value revisions to gradually narrow gaps in high-premium zones, sharpening land acquisition cost assumptions for upcoming metro and expressway-linked PPP corridors.
Generated 2026-09-26 from the engine's current numbers and recent headlines · refreshed weekly
5-year trend — city average, residential
Lime = engine's city average sale · sky = rent ₹/sq ft/month · dashed blue = YoY % · amber dots = credible prints (CRE Matrix / PropEquity / Knight Frank / IGR headlines, team deals) — 0 so far · 5Y sale +26.1% · rent +25.8%
- rent
- value
- yoy
Reckoner ↔ market correlation
market ≈ −₹1,953.4 + 2.1789 × reckoner · R² 0.998 · n = 18 micro-markets
Points above the line are micro-markets where the market has run further ahead of the government rate — expect higher land-acquisition cost and stamp-duty arbitrage; points below signal reckoner catch-up risk.
Recent public signals
Indicative desk estimates calibrated to government reckoner/circle rates and public signals; not a valuation. Refined daily and by team corrections. Reckoner source: Kaveri Online — Guidance Value. Unit: ₹ per sq ft carpet (land: ₹ per sq ft of plot).