
Ahmedabad rates, per sq ft carpet.
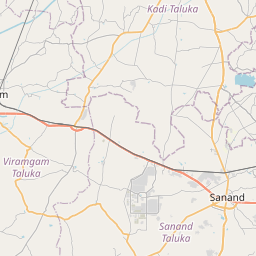
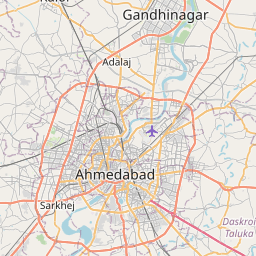

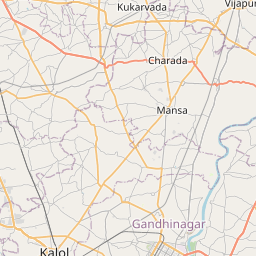

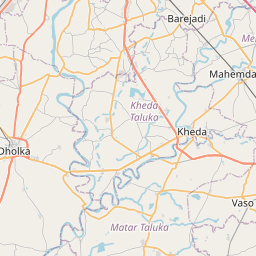

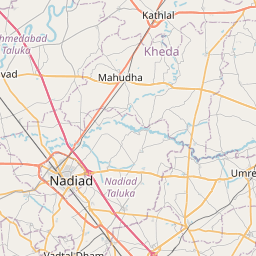
Pin = market rate, ₹/sq ft carpet. Click a pin to load it into the land-cost calculator.
| Micro-market | Market ₹/sq ft | Reckoner | Premium | Rent ₹/sq ft/mo | Yield · typical |
|---|---|---|---|---|---|
| West · 5 | |||||
| SG Highway – Bodakdev Central business district | ₹9,500 | ₹5,850 | +62.4% (+5.9% vs city line) | ₹19 | 2.4% 2 BHK ₹18,000/mo |
| Satellite – Prahlad Nagar Prime residential | ₹8,810 | ₹5,790 | +52.2% (-0.6% vs city line) | ₹19.8 | 2.7% 2 BHK ₹18,800/mo |
| Vastrapur – Thaltej Prime residential | ₹8,520 | ₹5,590 | +52.4% (0% vs city line) | ₹19.2 | 2.7% 2 BHK ₹18,200/mo |
| Ambli – Shilaj Prime residential | ₹8,200 | ₹5,400 | +51.9% (+0.1% vs city line) | ₹18.4 | 2.69% 2 BHK ₹17,500/mo |
| Bopal – South Bopal Established mid-market | ₹6,170 | ₹4,340 | +42.2% (-3% vs city line) | ₹15.9 | 3.09% 2 BHK ₹15,100/mo |
| North · 2 | |||||
| GIFT City – Gandhinagar Established mid-market | ₹7,520 | ₹5,250 | +43.2% (-5.2% vs city line) | ₹19.4 | 3.1% 2 BHK ₹18,400/mo |
| Chandkheda – Motera Established mid-market | ₹5,180 | ₹3,640 | +42.3% (+0.6% vs city line) | ₹13.4 | 3.1% 2 BHK ₹12,700/mo |
| North-West · 1 | |||||
| Gota – Jagatpur Growth suburb | ₹4,880 | ₹3,570 | +36.7% (-2.9% vs city line) | ₹13.8 | 3.39% 2 BHK ₹13,100/mo |
| South-West · 2 | |||||
| Shela – Sanand Rd Growth suburb | ₹4,780 | ₹3,490 | +37% (-2.2% vs city line) | ₹13.5 | 3.39% 2 BHK ₹12,800/mo |
| Sanand – Changodar Peripheral / emerging | ₹3,220 | ₹2,420 | +33.1% (+5.9% vs city line) | ₹9.9 | 3.69% 2 BHK ₹9,400/mo |
| East & South · 2 | |||||
| Maninagar – Isanpur Established mid-market | ₹4,750 | ₹3,360 | +41.4% (+1.8% vs city line) | ₹12.3 | 3.11% 2 BHK ₹11,700/mo |
| Naroda – Vastral Peripheral / emerging | ₹3,630 | ₹2,720 | +33.5% (+2% vs city line) | ₹11.2 | 3.7% 2 BHK ₹10,600/mo |
Land cost calculator — acquisition, stamp duty & TDR
Type a plot size; we apply the micro-market land rate, the state's stamp-duty rule (charged on the higher of market and reckoner value) and the local TDR pricing convention.
Acquisition (market)
₹57.28 cr
₹13,150/sq ft × 43,560 sq ft
Stamp duty + registration
₹3.38 cr
4.9% + 1% on ₹57.28 cr
Total outlay
₹60.66 cr
₹6,963 per buildable sq ft @ FSI 2
Gujarat: 4.9% + 1% registration (nil registration for women). TDR under GDCR. Indicative — confirm with the sub-registrar's current schedule.
Vidura market brief
Ahmedabad's residential market continues to trade well above Gujarat's Jantri (reckoner) rates across all tracked micro-markets, with premiums ranging from roughly 33% in peripheral industrial belts to over 62% in premium western corridors. SG Highway–Bodakdev leads the city at ₹9,500/sq ft against a ₹5,850 reckoner base, a 62.4% premium, followed closely by Satellite–Prahlad Nagar and Vastrapur–Thaltej, both above 52%. This wide and persistent gap in western Ahmedabad signals strong end-user and investor demand absorption capacity, but it also means land acquisition costs for PPP and infrastructure projects in these corridors will run well above official valuations, complicating compensation benchmarking and asset monetisation math. GIFT City–Gandhinagar, despite its institutional profile, shows a comparatively moderate 43.2% premium, suggesting room for structured land-pooling models. Peripheral zones like Sanand–Changodar and Naroda–Vastral, with premiums near 33%, offer more reckoner-aligned entry points, better suited for large-footprint industrial or logistics-linked PPP structuring. With no fresh policy triggers this week and a steady ~6.5% YoY appreciation trend, Ahmedabad's core-periphery valuation divergence is likely to widen further as western corridors continue to outpace formula-driven reckoner revisions.
Generated 2026-09-06 from the engine's current numbers and recent headlines · refreshed weekly
5-year trend — city average, residential
Lime = engine's city average sale · sky = rent ₹/sq ft/month · dashed blue = YoY % · amber dots = credible prints (CRE Matrix / PropEquity / Knight Frank / IGR headlines, team deals) — 0 so far · 5Y sale +18.8% · rent +19.2%
- rent
- value
- yoy
Reckoner ↔ market correlation
market ≈ −₹1,142.8 + 1.7284 × reckoner · R² 0.989 · n = 12 micro-markets
Points above the line are micro-markets where the market has run further ahead of the government rate — expect higher land-acquisition cost and stamp-duty arbitrage; points below signal reckoner catch-up risk.
Indicative desk estimates calibrated to government reckoner/circle rates and public signals; not a valuation. Refined daily and by team corrections. Reckoner source: Garvi — Jantri Rates. Unit: ₹ per sq ft carpet (land: ₹ per sq ft of plot).