India 2026 Product Carbon Footprints: PCF, EPD and Export Decarbonisation
By Sudarshan Karweer · sudarshan@growthifye.com · +91 84510 99371 (Call / WhatsApp) · 2026-09-02

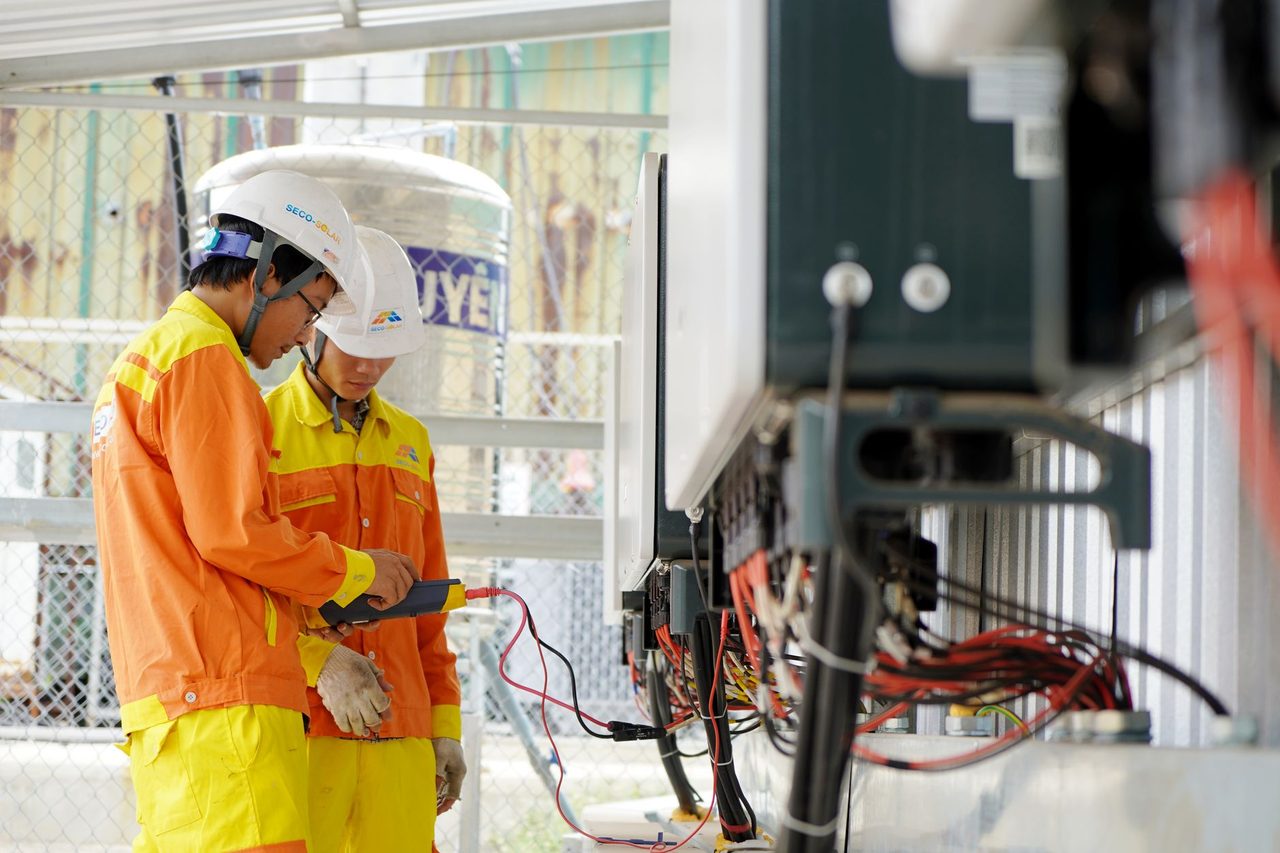
Photo: Mandiri Abadi on Pexels
Product carbon footprinting is moving from ESG reporting to commercial execution for Indian industry. In 2026, exporters are being asked for line-item emissions data, plant-specific energy mixes, recycled-content evidence, process-emission factors and third-party assured disclosures that can be used in procurement, compliance and customer claims. For many companies, this is the next layer after corporate Scope 1, 2 and 3 reporting: not just knowing total emissions, but knowing the carbon intensity of each tonne, sheet, component, batch or SKU.
For Indian manufacturers, this shift matters for three reasons. First, overseas buyers increasingly want product-level emissions data rather than company-average disclosures. Second, low-carbon differentiation is now influencing supplier selection in sectors such as steel, aluminium, chemicals, cement, auto components, textiles, packaging and engineered products. Third, product-carbon transparency is becoming essential for margin protection as exporters face tighter customer audits, embodied-carbon declarations and procurement-linked decarbonisation requirements.
This article explains how Indian companies can build a practical 2026 strategy for product carbon footprints, environmental product declarations, plant-level MRV and low-carbon product positioning without creating a data system that is expensive, fragile or impossible to audit.
Why product carbon data is now a commercial issue in 2026
Corporate carbon inventories remain important, especially for BRSR Core, investor disclosures, SBTi planning and lender diligence. But product carbon footprints, or PCFs, answer a different business question: what is the cradle-to-gate or cradle-to-customer emissions profile of the product being sold?
That difference matters in procurement.
A buyer sourcing rolled steel, speciality chemicals, aluminium extrusions, tiles, yarn, paperboard or fabricated parts increasingly wants to know:
- emissions per tonne or per unit delivered
- plant of origin and production route
- electricity source and renewable share
- recycled or secondary material content
- fuel mix and thermal-energy source
- process emissions where relevant
- transport emissions up to a declared boundary
- allocation method across co-products and by-products
- whether data is primary, secondary or estimated
- whether the PCF or declaration has external verification
In practice, this means Indian producers can no longer rely only on annual company-wide emissions totals. A firm may have a respectable corporate disclosure while still being unable to explain why Product A from Plant 1 has a much lower carbon intensity than Product B from Plant 2. Without that granularity, commercial teams struggle to defend premiums, qualify for preferred-supplier lists or answer overseas technical questionnaires.
In 2026, this issue is especially visible in export-facing sectors where customers are aligning procurement with climate targets, embodied-carbon screens and supplier scorecards. Even where no direct legal mandate exists, product carbon data is becoming part of tenders, framework agreements and long-term sourcing decisions.
PCF, EPD and LCA: what Indian companies should actually build
A lot of confusion comes from terminology. Companies hear PCF, life-cycle assessment, EPD, carbon declaration and digital product passport used almost interchangeably. They are related, but not identical.
A product carbon footprint is the quantified greenhouse-gas emissions associated with a defined product system over a defined boundary, often cradle-to-gate for industrial goods. It focuses on climate impact, usually expressed as kgCO2e per unit.
A life-cycle assessment, or LCA, is broader. It can include multiple environmental impacts beyond climate, such as water use, acidification, eutrophication and resource depletion.
An environmental product declaration, or EPD, is a standardised disclosure document based on prescribed product-category rules. In many sectors, an EPD is the format customers recognise because it allows comparisons using a common methodological framework.
For most Indian industrial firms, the right sequence in 2026 is:
- establish robust plant-level activity data
- create auditable product carbon footprint models for priority SKUs
- align methodologies with relevant standards and customer expectations
- issue EPDs or equivalent declarations for products and markets where they create commercial value
- connect product-level carbon data to sourcing, pricing and decarbonisation capex decisions
The mistake to avoid is jumping straight to polished declarations before fixing underlying data architecture. If meter hierarchies are weak, fuel records inconsistent, scrap-content data missing and production-routing logic unclear, the published number will not survive technical review.
This is why product carbon work should sit alongside Carbon accounting & disclosure and Carbon markets & MRV rather than being treated as a branding exercise.
The Indian sectors where product-level carbon is most urgent
Not every sector needs the same depth of product-level analysis immediately. In 2026, the highest urgency is typically seen in industries where energy intensity is high, export exposure is meaningful, product specifications vary materially, and buyers already ask for embodied-carbon information.
These commonly include:
- steel and stainless steel
- aluminium and copper products
- cement, clinker and downstream building materials
- fertilisers and industrial chemicals
- ceramics, glass and tiles
- textiles and technical fabrics
- pulp, paper and packaging products
- auto components and engineered assemblies
- polymers and plastic products
- electronics and electrical equipment with export supply chains
Take steel as an example. Emissions can vary significantly by route: BF-BOF, DRI-EAF, scrap-based EAF and hybrid configurations all have different carbon profiles. Within the same company, one mill may run on grid-heavy power at 0.70-0.85 tCO2/MWh effective location-based intensity, while another may reduce electricity emissions sharply through open-access solar, wind-solar hybrid or captive renewable energy. Natural gas use, coal injection rates, pellet mix, scrap ratio and yield losses further affect tonne-level carbon intensity. If the producer cannot map these differences by plant and product, it loses an opportunity to distinguish lower-carbon output commercially.
A similar story applies in aluminium, where power source is often the dominant driver; in cement, where clinker factor, thermal substitution and process emissions matter; and in chemicals, where feedstock pathway and steam/electricity configuration can materially change product carbon.
How to build a credible PCF system in an Indian manufacturing context
A credible product-carbon system is not just a spreadsheet. It is a repeatable data and governance process. In 2026, the most effective Indian implementations tend to follow six steps.
First, define business priorities. Start with products linked to exports, key accounts, large tenders or likely low-carbon premium potential. Trying to cover every SKU on day one usually slows delivery and weakens quality.
Second, establish system boundaries and methodology. Decide whether the initial scope is cradle-to-gate, gate-to-gate or cradle-to-customer. For most industrial exporters, cradle-to-gate is the practical starting point. Document treatment of purchased electricity, captive power, steam imports, process emissions, transport, packaging, recycled content and end-of-waste assumptions.
Third, improve data capture at plant level. This is where most programmes succeed or fail. Minimum data blocks usually include:
- monthly fuel consumption by type and process area
- electricity consumption from grid, captive and renewable sources
- production volumes by line, shift or batch where relevant
- steam, compressed air and utility allocations
- raw material input quantities and origin
- scrap generation and recycled feed share
- process emission drivers such as calcination or chemical conversion
- internal logistics and outbound transport distances
- quality rejects, rework and yield-loss data
Fourth, build allocation logic that reflects the physical reality of production. Shared utilities and multi-output processes are common in Indian plants. Allocation by mass, energy, revenue or process-engineering basis must be selected carefully and documented. This is particularly important in steel rolling complexes, integrated chemical sites, paper mills and diversified ceramics plants.
Fifth, verify before publishing. Even if external assurance is not immediately required, internal technical review should stress-test assumptions, factors and plant reconciliations. Product carbon numbers that cannot be traced back to utility bills, meter data, ERP records and production logs will not satisfy sophisticated customers.
Sixth, connect the PCF system to abatement planning. Product carbon should not remain a reporting output. It should inform capex and sourcing choices. That is where Net-zero roadmaps & MACC and RE-led decarbonisation become directly useful.
Where the biggest product-carbon reductions usually come from
Many companies assume product carbon reduction requires breakthrough technology from day one. In reality, the first 10-30% often comes from better energy and materials choices already available in India, though economics vary by sector.
The strongest 2026 levers commonly include:
- renewable electricity through open access, group captive or on-site solar
- storage-backed renewable procurement for high daytime and evening loads
- heat integration, waste-heat recovery and utility optimisation
- variable-frequency drives, motor upgrades and compressed-air efficiency
- electrification of low- and medium-temperature thermal loads where feasible
- biomass, biogas or RDF substitution in suitable thermal applications
- increased scrap or recycled-content use where metallurgically acceptable
- lower-clinker formulations in cement and construction materials
- improved yields, lower reject rates and reduced rework
- lower-emission inbound logistics and modal optimisation
For electricity-intensive sectors, renewable sourcing can materially improve product-level carbon intensity. In 2026, many industrial open-access deals in India still land in a broad range of roughly Rs 3.2-5.0/kWh depending on state, banking rules, contract structure, scheduling complexity and RTC requirement, versus significantly higher effective industrial grid tariffs in several states. Where the commercial structure is viable, this can lower both landed power cost and product carbon intensity at the same time.
For thermal loads, economics are more site-specific. Industrial heat pumps, electric boilers, induction systems, e-boilers and hybrid thermal configurations can work well for selected temperature bands, especially where renewable electricity can be contracted competitively and process controllability improves. For hard-to-abate high-temperature applications, green hydrogen may remain a pilot or selective-use option in 2026 rather than a mass-market decarbonisation lever, given delivered cost constraints.
The point is not that every decarbonisation measure is immediately cheap. The point is that product-level carbon data helps identify which measures reduce emissions on the specific products that matter commercially. That is much more actionable than a generic plant average.
Export readiness, customer claims and audit risk
As product-carbon disclosures become commercially relevant, so does audit risk. Indian producers should expect more customer scrutiny in 2026 on three fronts.
First, consistency between corporate and product-level data. If a company claims high renewable penetration in one disclosure but uses grid-average factors in product declarations without reconciliation, credibility suffers.
Second, evidence quality. Buyers increasingly ask whether the PCF relies on primary plant data or generic databases. Excessive dependence on secondary factors weakens confidence, especially when the supplier is claiming low-carbon differentiation.
Third, comparability. Products cannot be fairly compared unless declared units, boundaries and methodologies are aligned. A tonne of product declared gate-to-gate is not equivalent to a tonne declared cradle-to-gate with upstream raw materials and transport included.
This is why governance matters as much as modelling. A strong 2026 product-carbon programme should include:
- documented methodology notes for each product family
- version control for emission factors and assumptions
- plant sign-off and finance/operations review
- clear treatment of renewable electricity instruments and temporal matching
- evidence folders for utility bills, procurement records, meter exports and lab or process data
- a verification plan for high-priority products and export markets
Done well, this reduces the risk of commercial disputes, delayed customer approvals and reputational damage from overstated low-carbon claims.
What Indian companies should do in the next 12 months
For Indian C&I consumers, exporters, developers and lenders, product-level decarbonisation data is becoming part of mainstream industrial competitiveness. The practical 12-month agenda is straightforward.
- identify 5-20 priority products linked to exports, key customers or large domestic procurement opportunities
- map plant-level energy, fuel and production data needed for cradle-to-gate PCFs
- fix data gaps in metering, utility allocation and production traceability
- create baseline PCFs and test sensitivity to electricity mix, material mix and yield improvements
- evaluate renewable electricity and electrification options that directly lower product-carbon intensity
- prepare customer-ready declarations or EPD pathways for high-value product lines
- align internal approvals, assurance and document retention for future audits
- integrate product-carbon metrics into capex screening, sourcing and pricing strategy
The winners in 2026 will not be the firms with the most slideware. They will be the firms that can show a buyer, lender or regulator exactly how carbon is embedded in a product, exactly which levers reduce it, and exactly how the data is verified.
That capability is becoming a competitive asset for Indian manufacturing.
If your organisation needs a plant-to-product decarbonisation strategy, contact Growthifye's advisory desk. We help industry build auditable product-carbon systems, export-ready MRV frameworks and investment-linked decarbonisation plans grounded in Indian power, process and policy realities.
Explore Growthifye's related capabilities
This analysis connects directly to our advisory practice: Carbon accounting & disclosure · Net-zero roadmaps & MACC · RE-led decarbonisation · Industrial efficiency & electrification.
About the author

Chief Executive Officer, Growthifye — With over 23 years in management consulting, Sudarshan has taken businesses from concept to scale — building and scaling new-age digital and energy businesses.
- 23+ years in management consulting
- EY alumnus
- Led large-scale BESS programmes, capital raises and advisory mandates
Want this analysis applied to your project?
Talk to our team