India 2026 Product Carbon Footprint Strategy for Exporters and Industrial Supply Chains
By Sudarshan Karweer · sudarshan@growthifye.com · +91 84510 99371 (Call / WhatsApp) · 2026-09-13
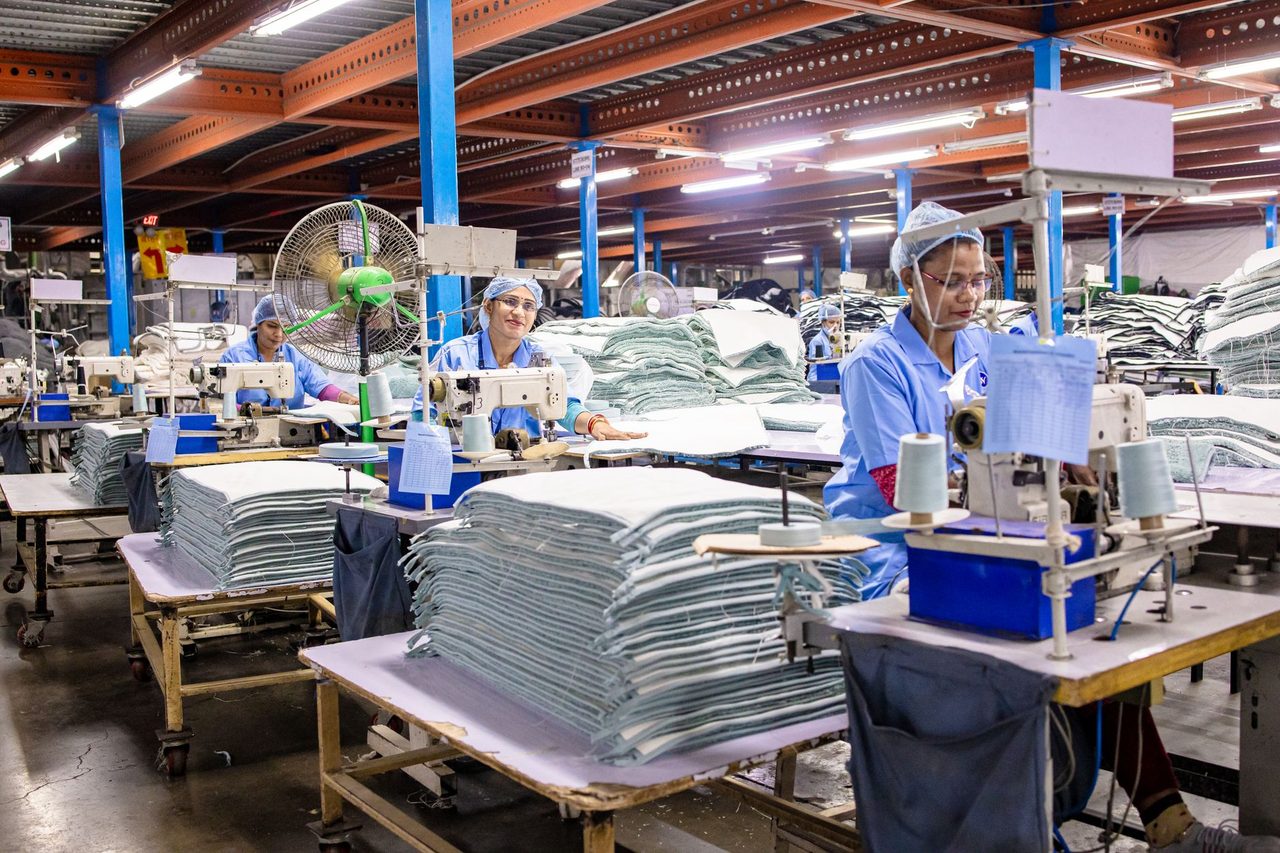
Photo: EqualStock IN on Pexels
Indian industrial decarbonisation in 2026 is moving beyond enterprise-wide inventories. Many companies already have some level of Scope 1 and Scope 2 reporting, and larger firms are now improving Scope 3 supplier engagement. But the commercial pressure point is shifting to product-level emissions data. For exporters, OEM suppliers and material-intensive manufacturers, product carbon footprinting, or PCF, is becoming central to customer qualification, price negotiations, preferred-supplier status and border compliance.
This is a different problem from corporate carbon accounting. A company may know its annual tCO2e emissions and still be unable to answer a customer’s question on the embedded emissions of one tonne of hot rolled steel, one kilogram of specialty chemical, one battery pack, one cement bag or one fabricated component. In practice, that gap creates commercial risk.
For Indian C&I consumers, RE developers, lenders and policymakers, PCF is now where emissions data meets market access. It affects exporters facing carbon-linked disclosure requests, domestic suppliers feeding global value chains, and project sponsors seeking financing for low-carbon process upgrades. It also changes how renewable power, electrification, fuel switching and material efficiency are evaluated, because the unit of analysis moves from annual plant emissions to emissions per unit of product.
This article sets out a practical 2026 strategy for building product carbon footprints in India: what PCF includes, how data systems should be designed, where companies go wrong, how PCF links to CBAM and procurement, and which decarbonisation levers reduce product-level emissions fastest.
Why PCF matters in India in 2026
Three shifts explain why product carbon footprinting has become urgent.
First, export markets are asking more detailed emissions information at product level. Even where regulations apply initially to a limited set of sectors, buyers across engineering goods, chemicals, mobility, packaging and consumer products are expanding supplier questionnaires. They want primary plant data, not only generic emission factors.
Second, large Indian corporates are tightening procurement expectations for their own suppliers. Automotive, electronics, industrial equipment and infrastructure value chains increasingly ask vendors to provide energy intensity, recycled content, renewable electricity share and product-level carbon metrics. For suppliers, inability to provide credible PCF data can become a bid disqualification issue.
Third, cost competitiveness is becoming carbon competitiveness. Two plants making the same product may have sharply different carbon intensity because of fuel mix, clinker factor, scrap ratio, grid dependence, captive coal use, furnace technology, process yield or logistics configuration. As carbon performance starts influencing procurement and trade, PCF becomes a strategic operating metric.
In the Indian context, this matters especially for sectors such as:
- Iron and steel
- Aluminium and non-ferrous metals
- Cement and building materials
- Fertilisers and chemicals
- Textiles and technical fibres
- Auto components and engineering goods
- Packaging materials
- Data-centre-linked hardware and electrical equipment
Corporate inventory versus product carbon footprint
A corporate GHG inventory measures emissions across an entity over a reporting period. A PCF measures emissions associated with a specific product, usually from cradle-to-gate for industrial trade applications, though some value chains ask for cradle-to-grave.
That distinction sounds simple but creates major methodological consequences.
For a corporate inventory, finance and EHS teams can often aggregate annual fuel, electricity and refrigerant data and apply standard emission factors. For PCF, companies must assign those emissions to products. That requires process mapping, bill-of-material analysis, production routing, utility allocation, yield-loss treatment, by-product handling and sometimes batch-level traceability.
A credible PCF system usually needs answers to questions such as:
- What is the declared unit: per kg, per tonne, per component, per m2, per pack?
- What lifecycle boundary is being used: cradle-to-gate, gate-to-gate or cradle-to-grave?
- How are common utilities allocated across multiple product lines?
- How are co-products treated: mass allocation, energy allocation, economic allocation or system expansion?
- Are inbound raw-material footprints based on supplier-specific data or secondary databases?
- How are scrap, rework, rejects and process losses treated?
- How often is the footprint refreshed: annual average, monthly or batch-specific?
These are not academic details. They determine whether a PCF number is credible in customer audits and whether the number is useful for internal decarbonisation decisions.
Building a plant-to-product carbon data stack
The most common Indian challenge is not absence of emissions data, but mismatch between operational systems and carbon-accounting requirements. Energy bills sit with finance, process data sits with operations, procurement sits in ERP, logistics sits elsewhere, and no one has a defensible method to allocate emissions to finished goods.
A practical PCF data stack in 2026 should have five layers.
First, activity data capture. This includes fuel consumption by line or process area, electricity import, captive generation, steam, compressed air, industrial gases, material consumption, transport activity and waste treatment. Plants with sub-metering are far better placed than those relying only on monthly utility bills.
Second, production and routing data. Companies need actual product output, line utilisation, batch records, conversion factors, standard recipes, throughput and yield losses. Without this layer, utility emissions cannot be meaningfully allocated.
Third, emission factor governance. This includes grid electricity factors, fuel factors, upstream material factors, transport factors and waste-treatment factors. In India, the quality of supplier-specific upstream data varies sharply, so firms often start with proxy factors and improve over time.
Fourth, allocation logic. Shared boilers, furnaces, chillers, DGs, common compressors and mixed production lines require documented allocation rules. These should be technically explainable and consistently applied.
Fifth, review and assurance. Internal controls, version management, audit trail, assumptions register and exception handling are essential. This is where Carbon accounting & disclosure capabilities become valuable, especially when customer scrutiny or financing diligence is expected.
For many companies, an effective starting point is to prioritise 20 to 30 products that drive most revenue, export volume or customer exposure, rather than attempting all SKUs at once.
Method choices that can materially change the PCF number
In Indian manufacturing, several methodological choices can alter product footprints by 10% to 40% or more.
Electricity treatment is one. A plant using 30% to 60% renewable power through open access, captive solar, group captive or I-RECs may want product-level recognition of lower electricity emissions. But the accounting treatment must be consistent with the reporting framework and the customer’s rules. If market-based electricity claims are used, contractual and temporal matching evidence must be maintained properly.
Allocation across co-products is another major issue. In refineries, chemicals, metals and agro-processing, the footprint of one product can change substantially depending on whether burdens are split by mass, energy content or economic value. Companies should not switch methods opportunistically; they need a stable rule aligned to customer and standard requirements.
Treatment of recycled content also matters. For metals, plastics, paper and packaging, upstream footprint assumptions differ depending on scrap origin, recycled-content methodology and end-of-life assumptions. If a company claims low-carbon product advantage through high scrap usage, traceability must support that claim.
Transport can also be understated. For export-oriented products, inland logistics, port handling and shipping-related assumptions can be commercially relevant, even if the buyer mainly asks for cradle-to-gate data. Plants far from ports or with inefficient internal logistics may carry hidden carbon intensity.
Finally, temporal averaging creates risk. An annual average product footprint can hide seasonal changes in grid intensity, captive fuel use, kiln performance or product mix. Buyers increasingly ask whether the PCF reflects site-specific recent conditions or a broad annual estimate.
Where PCF links to CBAM, procurement and finance
PCF is not the same as CBAM compliance, but there is meaningful overlap. Companies building plant-level emissions measurement, process mapping and product allocation systems for one purpose will often improve readiness for the other. More importantly, both require primary data discipline.
For exporters to carbon-conscious markets, a defensible PCF can support:
- Customer disclosure requests
- Tender pre-qualification
- Low-carbon product differentiation
- Contract negotiations linked to emissions intensity
- Internal prioritisation of abatement capex
- Lender diligence on decarbonisation projects
This is especially relevant where decarbonisation investments have a measurable impact on product-level emissions intensity. Examples include replacing furnace oil with biomass or electricity, reducing clinker factor, increasing scrap charge, deploying waste-heat recovery, shifting daytime load to solar-backed power, or improving kiln and furnace efficiency.
Lenders and investors in 2026 increasingly ask not only whether a project reduces annual emissions, but whether the reduction improves market positioning and resilience. A capex proposal that lowers product carbon intensity from, say, 2.4 tCO2e per tonne to 2.0 tCO2e per tonne can be easier to defend commercially than a generic enterprise-level reduction target. This is where Net-zero roadmaps & MACC can be translated into product-linked business cases.
Decarbonisation levers that reduce product-level emissions fastest
Once a company has a baseline PCF, the next question is practical: which levers move the number fastest and at what cost?
In Indian industry, the answer usually sits in five areas.
First, renewable electricity procurement. Where electricity is a meaningful share of product emissions, open access solar, hybrid wind-solar, group captive structures and storage-backed supply can materially reduce product intensity. In 2026, many large C&I consumers still see landed open access renewable tariffs broadly in the range of about INR 4.0 to 6.5 per kWh depending on state, banking rules, scheduling profile and contract structure. Compared with industrial grid tariffs often around INR 6.5 to 9.5 per kWh, this can deliver both carbon and cost benefits where policy conditions are supportive.
Second, industrial electrification. Replacing fossil-thermal processes with electric alternatives is not universally feasible, but there are high-potential use cases in low- and medium-temperature heat, drying, boiler substitution in selected applications, induction systems and electric material-handling fleets. The key is to assess not only energy efficiency but also hourly power quality, load factor and renewable matching.
Third, efficiency and yield improvement. In many plants, product carbon intensity can drop faster through lower rejects, improved heat integration, variable frequency drives, motor-system optimisation, compressed-air fixes, combustion tuning and process control than through large headline projects. Because PCF is emissions per unit product, yield improvement often has an outsized effect.
Fourth, material substitution and circularity. Higher recycled input, lower-emission feedstock, clinker substitution, solvent recovery, lightweighting and packaging redesign can significantly reduce upstream embedded emissions. These often matter more for PCF than for site-only emissions analysis because purchased materials dominate the footprint.
Fifth, green fuels for hard-to-abate segments. For sectors using high-temperature heat or hydrogen feedstock, green hydrogen and other low-carbon fuels remain selective rather than universal in 2026. Delivered economics are still challenging for broad deployment, but in export-linked, premium-sensitive or policy-supported niches they can become strategically relevant. Companies should evaluate them with disciplined boundary assumptions and phased adoption rather than headline announcements.
A robust marginal abatement cost view should assess each lever not only in INR per tCO2e avoided, but also in impact per tonne of product, customer acceptance, implementation time and measurement confidence. That is where RE-led decarbonisation and Industrial efficiency & electrification need to connect directly to product-level MRV.
Common mistakes Indian companies should avoid
Several recurring errors slow down PCF programmes.
- Treating PCF as a one-time consultant exercise instead of an operating data system
- Using generic secondary factors for all key raw materials when supplier-specific data is available
- Ignoring allocation logic until a customer asks for it
- Claiming renewable electricity benefits without contract and meter evidence
- Leaving production, QA and costing teams out of the methodology discussion
- Publishing product-level numbers without internal review controls
- Failing to connect PCF outputs to capex prioritisation and procurement strategy
Another common mistake is excessive precision too early. A company does not need perfect batch-level product footprints for every SKU in phase one. It needs a credible, explainable methodology for priority products, a clear improvement roadmap, and governance strong enough to withstand customer challenge.
A practical 12-month roadmap for 2026
For Indian manufacturers and exporters starting now, a workable 12-month PCF roadmap can look like this:
- Months 1-2: select priority products, define use cases, choose boundaries and declared units
- Months 2-4: map process flows, utility systems, material inputs and production routing
- Months 3-6: build activity-data templates, meter hierarchy, factor library and allocation rules
- Months 5-7: calculate pilot PCFs for selected products and test sensitivity to assumptions
- Months 7-9: validate with operations, procurement, finance and customer-facing teams
- Months 8-10: identify top abatement levers linked to product intensity reduction
- Months 10-12: embed refresh cycle, internal controls, customer response pack and capex pipeline
Companies that already have strong MRV for enterprise inventories can move faster. But they should still expect non-trivial effort on product mapping and allocation. This is not only a reporting task; it is an operating-model change.
In 2026, product carbon footprinting is becoming a core industrial capability for Indian companies exposed to global markets and carbon-aware procurement. The winners will not be those with the most polished sustainability deck, but those with defensible plant-to-product data, clear allocation logic and a visible abatement pathway tied to cost and competitiveness.
If your business needs to build product-level emissions baselines, improve MRV, prioritise low-carbon capex or connect PCF to export and procurement strategy, contact Growthifye’s advisory desk. We support Indian industry with practical decarbonisation planning, carbon-data systems and implementation-focused execution.
Explore Growthifye's related capabilities
This analysis connects directly to our advisory practice: Carbon accounting & disclosure · Net-zero roadmaps & MACC · RE-led decarbonisation · Industrial efficiency & electrification.
About the author

Chief Executive Officer, Growthifye — With over 23 years in management consulting, Sudarshan has taken businesses from concept to scale — building and scaling new-age digital and energy businesses.
- 23+ years in management consulting
- EY alumnus
- Led large-scale BESS programmes, capital raises and advisory mandates
Want this analysis applied to your project?
Talk to our team