GIS and AMR for Indian DISCOMs 2026: Network Mapping, Metering and RDSS ROI
By Sudarshan Karweer · sudarshan@growthifye.com · +91 84510 99371 (Call / WhatsApp) · 2026-09-07
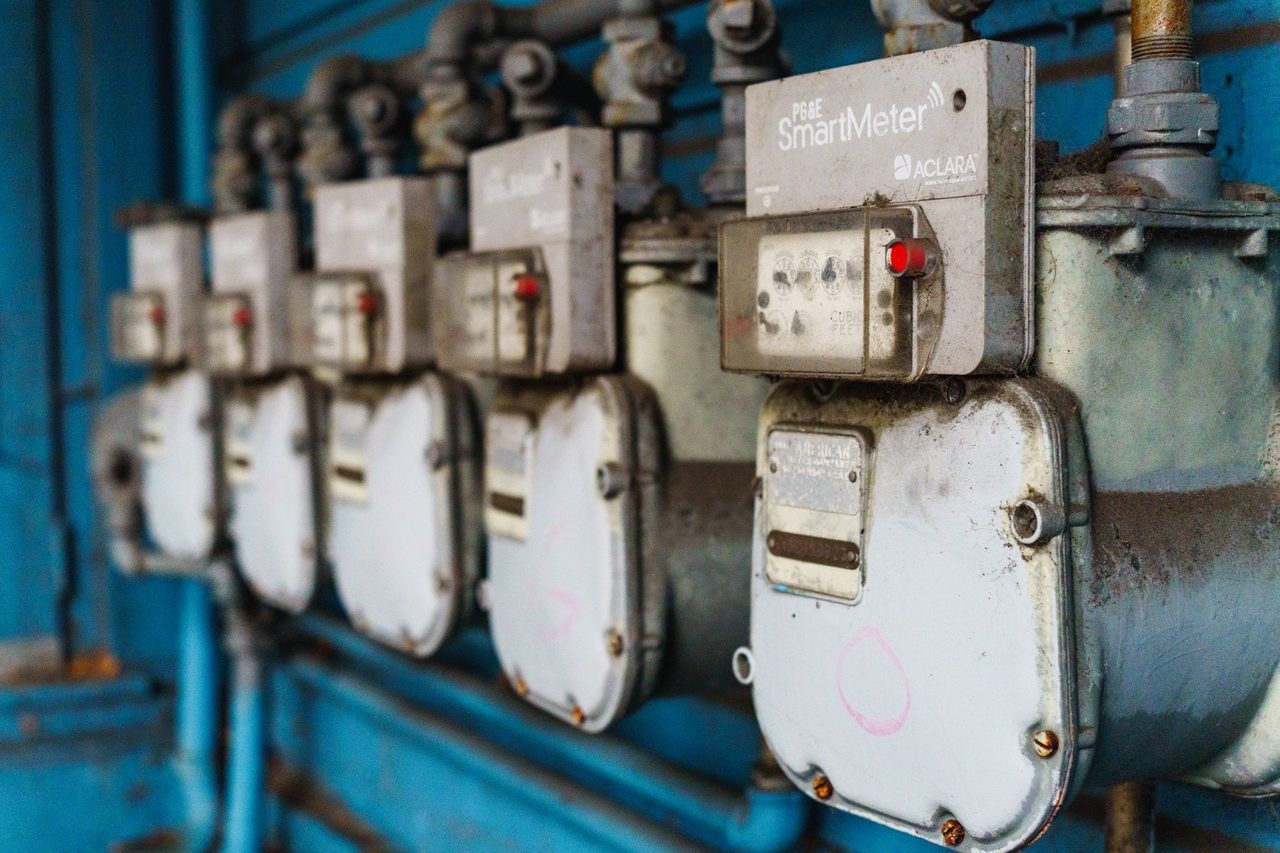
India’s utility digitalisation discussion often jumps straight to ADMS, DER orchestration and full AMI roll-outs. But for many DISCOMs in 2026, the highest-confidence gains still come from getting two foundational layers right: geospatial network mapping and reliable automated meter reading for priority consumer segments. A GIS-linked AMR architecture is not as glamorous as a digital twin or a full-scale DERMS programme, yet it can materially improve billing accuracy, feeder energy accounting, auditability and AT&C loss reduction within 12 to 24 months.
For state utilities working under RDSS, for private distribution licensees tightening revenue assurance, and for lenders evaluating digital capex, this matters because the business case is grounded in measurable operational outcomes rather than future optionality. For C&I consumers and renewable developers, the same stack improves data transparency at boundary points, open-access accounting readiness and dispute resolution on energy balances.
This article looks at why GIS plus AMR is emerging as a practical 2026 priority for Indian DISCOMs, where it fits relative to AMI, what savings it can unlock, and how to structure procurement and implementation for bankable results.
Why GIS-linked AMR is the practical next step for many Indian DISCOMs
A large number of Indian DISCOMs now have some combination of feeder metering, distribution transformer metering, legacy AMR for HT consumers, partial smart meter deployment, and SCADA in urban pockets. What is often missing is a trusted system of record connecting the physical network to the consumer and meter hierarchy.
Without a clean geospatial asset model, utilities struggle with basic questions:
- Which consumers are connected to which DT and feeder?
- Which boundary meters are valid for energy accounting and which are defective or bypassed?
- Where do sanctioned load, billed consumption and technical-loss assumptions diverge abnormally?
- Which pockets should be prioritised for theft enforcement, reconductoring, capacitor placement or smart-meter migration?
GIS solves the topology and asset-visibility problem. AMR solves the periodic, dependable data-acquisition problem for high-value nodes. Together, they create the minimum viable digital architecture for feeder-to-consumer energy traceability.
In practice, this means:
- GIS mapping of feeders, DTs, substations, poles, switchgear and consumer coordinates
- Consumer indexing and meter indexing against network assets
- AMR on HT consumers, EHT interfaces, major LT bulk consumers, feeders and DT meters where communication is viable
- Data reconciliation between billing, MDM/HES where available, outage records and field survey data
For utilities not yet ready for universal AMI coverage, this is a far more achievable sequencing strategy than trying to digitalise everything at once.
The 2026 business case: where the rupee value actually comes from
The strongest ROI case for GIS-linked AMR does not come from one single line item. It comes from a stack of benefits that are individually modest but collectively compelling.
First, better energy accounting. If feeder input is measured correctly and major downstream consumers are read automatically and tagged accurately to the network, the utility can isolate loss pockets faster. In many states, urban industrial feeders may show aggregate losses below 10%, while mixed rural feeders can still exceed 25% to 35%. The problem is that in several circles these numbers are not fully trustworthy because consumer indexing is stale and feeder bifurcations are not reflected correctly in records.
Second, billing-cycle closure improves. AMR for HT and key bulk consumers reduces manual reading delays, estimated billing and disputes over maximum demand, TOD consumption or meter non-access. For a DISCOM with significant industrial revenue concentration, even a 1 to 2 day reduction in billing-cycle lag can improve cash-flow timing materially.
Third, revenue protection improves. If GIS shows a sanctioned industrial consumer physically sitting on a spur with unusual load growth while AMR data indicates sudden consumption suppression, the utility has a high-probability inspection target. In theft-prone urban and peri-urban pockets, combining map-based anomaly clustering with meter data often yields better field-enforcement productivity than routine patrols.
Fourth, capex prioritisation improves. A DISCOM can use feeder-wise and DT-wise mapped losses to decide where conductor augmentation, HVDS conversion, AB cabling, meter replacement or smart-meter rollout will create the highest marginal benefit. This matters under RDSS because utilities and state governments are under pressure to show measurable loss and reliability outcomes from investment.
Fifth, dispute resolution improves for C&I and open-access stakeholders. Accurate GIS-tagged boundary points make it easier to validate supply source, feeder classification, outage exposure and energy balances relevant to wheeling, banking adjustments, standby issues and power-quality accountability.
In rupee terms, the range can be meaningful. Consider a circle with annual input energy of 2,000 MU and average revenue realisation of Rs 6.2/kWh. If GIS-linked AMR helps identify and reduce just 1.5 percentage points of commercial loss, the annual value is roughly:
- 2,000 MU x 1.5% = 30 MU recovered
- 30 MU x Rs 6.2/kWh = about Rs 18.6 crore per year
That excludes working-capital improvement, lower meter-reading opex, avoided billing disputes and better capex targeting. In higher-tariff industrial areas, the revenue effect can be larger.
Where AMR still beats full AMI on practicality
In 2026, AMI is central to India’s long-term distribution reform path, especially under smart prepaid metering programmes linked to RDSS. But practitioners know that AMI deployment quality is uneven across states, communication networks vary, and universal endpoint visibility takes time.
AMR remains highly relevant in three situations:
- Legacy HT and EHT consumer bases where interval data is needed quickly with limited endpoint count
- Feeder, DT and boundary metering where polling architecture is simpler and economics are straightforward
- Utilities that need interim data visibility while larger AMI contracts, HES integration or prepaid migration are still stabilising
AMR also works well where the main objective is not customer engagement or remote connect-disconnect, but dependable acquisition of billing-grade and audit-grade data from critical nodes.
A practical sequencing model many DISCOMs can use is:
- Phase 1: GIS survey, consumer indexing, feeder and DT map validation
- Phase 2: AMR for feeders, DTs, HT consumers, key LT bulk consumers and boundary points
- Phase 3: Data integration with billing, outage and asset systems
- Phase 4: Targeted AMI expansion based on loss and collection priority
- Phase 5: Advanced applications such as SCADA / ADMS integration where the network maturity justifies it
This sequencing avoids the common mistake of layering advanced analytics over poor network master data.
Implementation architecture: what good looks like on the ground
A robust GIS-linked AMR programme is less about software branding and more about data discipline, communications reliability and governance. The minimum architecture should include:
- A GIS platform with substation, feeder, DT, switch, pole and consumer layers
- Unique asset IDs and meter IDs harmonised across billing, asset and field systems
- Consumer indexing with physical verification, GPS tagging and phase association where relevant
- AMR communication stack using RF, GPRS/4G/5G or hybrid options depending on site economics
- Meter data repository with validation, estimation and exception workflows
- Dashboards for feeder balance, DT loss, consumer non-read, tamper alarms and billing exceptions
- Field mobility tools for survey correction and inspection closure
Utilities should insist on Vendor-neutral specifications at the RFP stage. This is especially important because GIS, AMR, billing and SCADA vendors often push proprietary data models that create long-term lock-in. For lenders and state nodal agencies, interoperability risk is not a technical footnote; it directly affects future integration cost and performance sustainability.
Implementation quality depends heavily on field survey integrity. In many projects, 20% to 40% of effort sits in cleaning legacy records, resolving duplicate consumer IDs, validating transformer-consumer relationships and fixing coordinate errors. If this stage is rushed, every downstream dashboard looks sophisticated but remains operationally weak.
The testing regime also matters. Meter communication performance, GIS data completeness, and reconciliation logic should be validated from FAT to SAT with clearly defined acceptance metrics. Typical thresholds may include:
- GIS asset completeness above 98% for the approved scope
- Consumer indexing accuracy above 95% after joint verification
- Daily AMR read success above 90% for communication-feasible nodes after stabilisation
- Feeder-to-billing energy-balance reports available within defined T+ timelines
- Exception-resolution workflows closed within SLA bands
RDSS alignment, regulatory context and lender relevance in 2026
RDSS remains the anchor reform framework for distribution infrastructure strengthening and operational improvement in 2026. While much of the public attention is on prepaid smart metering, the programme logic also strongly supports foundational improvements in energy accounting, consumer indexing, system metering and loss reduction.
A GIS-linked AMR package fits this reform logic because it supports:
- Baseline establishment for AT&C loss measurement
- Consumer database cleaning and meter-consumer-asset linkage
- Feeder and DT-level accounting for investment prioritisation
- Better auditability of utility performance claims
- Improved readiness for later AMI, outage systems and advanced control applications
For regulators and policymakers, this approach also improves the credibility of tariff petitions and true-up submissions where aggregate loss numbers are often debated. For lenders and project financiers, better utility data quality reduces uncertainty around cash-flow estimates, capex phasing and reform-linked disbursement conditions.
For C&I consumers, especially those dealing with demand charges in the Rs 300/kVA to Rs 550/kVA range and energy tariffs often between Rs 6.5/kWh and Rs 9.5/kWh depending on state and voltage level, accurate automated reading and boundary mapping can reduce billing friction and improve visibility on supply-performance issues.
For renewable developers connecting captive, group captive or third-party sale arrangements, correct source-load mapping and feeder classification are increasingly important as distribution systems become more data-driven and regulatory scrutiny on energy accounting intensifies.
Common failure points and how DISCOMs can avoid them
The biggest implementation failure is treating GIS as a one-time survey rather than a living operational system. Networks change constantly: new consumers are added, DTs are bifurcated, feeders are reconfigured, and field conditions diverge from sanctioned records. Unless utilities fund and enforce update workflows, GIS degrades quickly.
The second failure is fragmented ownership. GIS may sit with IT, AMR with metering, feeder accounting with operations, and billing data with commercial teams. Without a single programme governance structure, exceptions remain unresolved across departments.
The third failure is poor communication design. Some utilities over-specify always-on communications for remote sites where economics do not support it, while others under-specify redundancy for high-value urban and industrial nodes. Communication architecture should be tailored by asset criticality and terrain.
The fourth failure is weak use-case design. If the project is sold internally only as a mapping exercise, business users lose interest. If it is linked to monthly feeder energy audit, theft targeting, HT billing quality, open-access accounting support and capex prioritisation, operational ownership becomes stronger.
The fifth failure is skipping integration planning. Even if a DISCOM is not immediately implementing enterprise-wide advanced control, the GIS-AMR stack should be future-ready for IEC 61968/61970-style integration logic, substation data exchange and eventual SCADA / ADMS integration.
A disciplined utility should define 10 to 15 measurable KPIs from day one, such as:
- Feeder-wise energy accounting coverage
- DT-wise loss visibility coverage
- HT billing exceptions per cycle
- Non-communicating critical meters
- Consumer indexing mismatch rate
- Time to inspection closure after anomaly detection
- Collection improvement in targeted circles
- Reduction in provisional or estimated bills for priority segments
What decision-makers should do in the next 6 months
For DISCOM leadership, the right question in 2026 is not whether advanced digitalisation is desirable. It is which sequence creates the fastest credible value with the least integration regret. In many states, GIS-linked AMR is that sequence.
A practical six-month roadmap would be:
- Identify 2 to 4 circles with high loss, high C&I revenue concentration or poor consumer-indexing quality
- Conduct a rapid diagnostic of feeder maps, meter hierarchy, HT billing exceptions and DT metering availability
- Create a unified data model for asset IDs, consumer IDs and meter IDs
- Issue a tightly scoped bid with Vendor-neutral specifications and explicit interoperability requirements
- Prioritise feeders, boundary points, HT consumers and key DT clusters for AMR visibility
- Build governance across commercial, metering, operations and IT functions
- Define acceptance metrics and test protocols from FAT to SAT
- Link dashboard outputs to actual field-enforcement and capex decisions
For private utilities and franchisees, the same logic applies with even stronger urgency because revenue assurance and service quality have direct commercial consequences. For C&I users and renewable stakeholders, these projects are worth tracking because they can materially improve transparency in metering, billing and network accountability.
India’s distribution modernisation will ultimately include AMI at scale, advanced outage management, self-healing feeders and DER orchestration. But utilities do not need to wait for the end-state to start generating value. When the asset map is trusted and critical meter data is dependable, loss reduction stops being a spreadsheet exercise and becomes an operational discipline.
If your organisation is planning a GIS, AMR or RDSS-aligned utility digitalisation programme, contact Growthifye’s advisory desk. Growthifye supports DISCOMs, developers, lenders and energy users with technical due diligence, programme design, Vendor-neutral specifications and implementation oversight.
Explore Growthifye's related capabilities
This analysis connects directly to our advisory practice: IEC 61850 substation automation · FLISR & self-healing networks · DER management systems · SCADA / ADMS integration.
About the author

Founder & CEO, Growthifye — engineering and financing India's clean-energy transition.
Want this analysis applied to your project?
Talk to our team