
Visakhapatnam rates, per sq ft carpet.
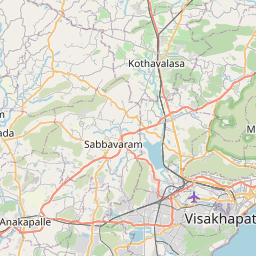
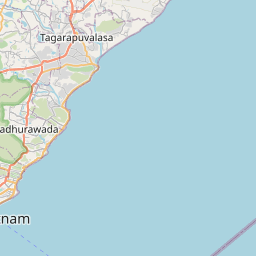
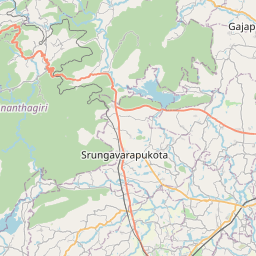
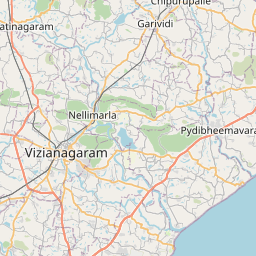
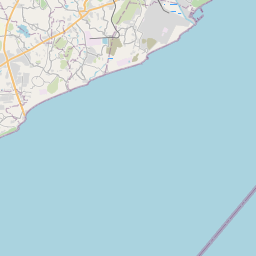



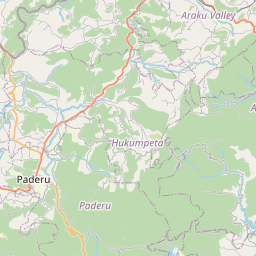
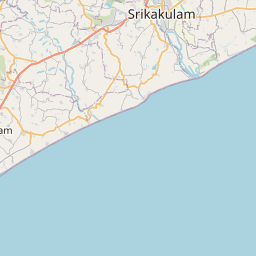
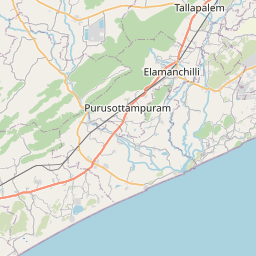

Pin = market rate, ₹/sq ft carpet. Click a pin to load it into the land-cost calculator.
| Micro-market | Market ₹/sq ft | Reckoner | Premium | Rent ₹/sq ft/mo | Yield · typical |
|---|---|---|---|---|---|
| Beach Rd – Siripuram Central business district | ₹11,580 | ₹7,080 | +63.6% (+3.3% vs city line) | ₹23.2 | 2.4% 2 BHK ₹22,000/mo |
| Seethammadhara – Dwaraka Nagar Prime residential | ₹9,580 | ₹6,250 | +53.3% (-1.5% vs city line) | ₹21.6 | 2.71% 2 BHK ₹20,500/mo |
| MVP Colony Prime residential | ₹8,880 | ₹5,790 | +53.4% (-0.3% vs city line) | ₹20 | 2.7% 2 BHK ₹19,000/mo |
| Rushikonda – Yendada Established mid-market | ₹7,190 | ₹5,040 | +42.7% (-5% vs city line) | ₹18.6 | 3.1% 2 BHK ₹17,700/mo |
| Madhurawada Established mid-market | ₹6,240 | ₹4,340 | +43.8% (-1.3% vs city line) | ₹16.1 | 3.1% 2 BHK ₹15,300/mo |
| Gajuwaka Growth suburb | ₹4,560 | ₹3,350 | +36.1% (0% vs city line) | ₹12.9 | 3.39% 2 BHK ₹12,300/mo |
| Anandapuram – Bheemili Peripheral / emerging | ₹3,760 | ₹2,870 | +31% (+1.5% vs city line) | ₹11.6 | 3.7% 2 BHK ₹11,000/mo |
| Pendurthi – Sabbavaram Peripheral / emerging | ₹3,370 | ₹2,570 | +31.1% (+6.4% vs city line) | ₹10.4 | 3.7% 2 BHK ₹9,900/mo |
Land cost calculator — acquisition, stamp duty & TDR
Type a plot size; we apply the micro-market land rate, the state's stamp-duty rule (charged on the higher of market and reckoner value) and the local TDR pricing convention.
Acquisition (market)
₹7.36 cr
₹1,690/sq ft × 43,560 sq ft
Stamp duty + registration
₹55.2 lakh
6.5% + 1% on ₹7.36 cr
Total outlay
₹7.91 cr
₹908 per buildable sq ft @ FSI 2
Andhra Pradesh: 5% stamp + 1.5% transfer duty + 1% registration. TDR bonds under APCRDA. Indicative — confirm with the sub-registrar's current schedule.
Vidura market brief
Visakhapatnam's residential market trades well above IGRS AP reckoner values across all tracked micro-markets, with premiums ranging from 31% in peripheral zones to nearly 64% in the core. Beach Road–Siripuram commands the steepest gap (₹11,580 vs ₹7,080/sq ft, +63.6%), followed by Seethammadhara–Dwaraka Nagar and MVP Colony, both near 53%. This widening spread between transacted and government values matters directly for infrastructure investors: land acquisition costs for PPP corridors running through these established addresses will price well above circle-rate compensation benchmarks, complicating stamp-duty-linked valuations and rehabilitation negotiations. Conversely, growth-corridor locations like Madhurawada, Rushikonda–Yendada, and peripheral Pendurthi–Sabbavaram offer thinner premiums (31-44%), making them more viable for asset monetisation and greenfield PPP structuring at closer-to-reckoner economics. With city-wide residential values trending near 7.5% YoY and redevelopment activity already visible—as seen in the Velampeta housing scheme—premium compression at the core versus acceleration at the fringe is likely to reshape where future infrastructure capital finds better risk-adjusted entry points.
Generated 2026-09-26 from the engine's current numbers and recent headlines · refreshed weekly
5-year trend — city average, residential
Lime = engine's city average sale · sky = rent ₹/sq ft/month · dashed blue = YoY % · amber dots = credible prints (CRE Matrix / PropEquity / Knight Frank / IGR headlines, team deals) — 0 so far · 5Y sale +21.9% · rent +21.7%
- rent
- value
- yoy
Reckoner ↔ market correlation
market ≈ −₹1,411.6 + 1.7821 × reckoner · R² 0.994 · n = 8 micro-markets
Points above the line are micro-markets where the market has run further ahead of the government rate — expect higher land-acquisition cost and stamp-duty arbitrage; points below signal reckoner catch-up risk.
Recent public signals
Indicative desk estimates calibrated to government reckoner/circle rates and public signals; not a valuation. Refined daily and by team corrections. Reckoner source: IGRS AP — Market Value. Unit: ₹ per sq ft carpet (land: ₹ per sq ft of plot).